Bullish News
Collection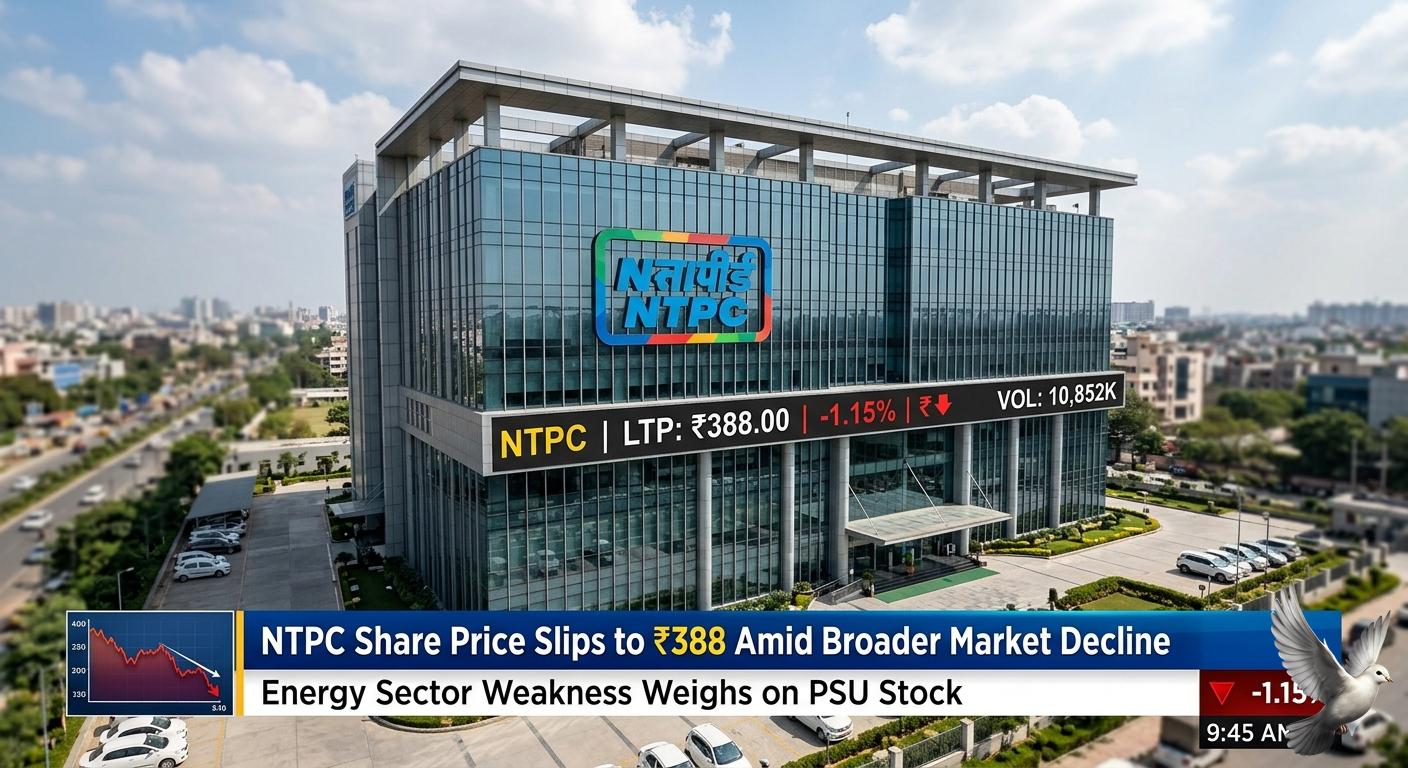
NTPC Share Price Slips to ₹388 Amid Broader Market Decline
NTPC share price edged down by nearly 1% during early trading hours, following a broader market contraction that pulled major energy and power utility counters lower. The public sector undertaking opened at ₹393.00, compared to its previous close of ₹395.25, and witnessed a low of ₹387.10 before steadying around the ₹388.30 mark. Despite the temporary negative momentum, fundamental market indicators reflect consistent operational metrics. The company commands a dominant market capitalization of ₹3,76,521 crore. It continues to trade with a price-to-earnings ratio of 15.57 and healthy annual earnings per share of ₹24.93, reinforcing its stable valuation framework. Broader corporate indicators indicate the long-term price action remains positive. While short-term intraday charts show mild consolidation, the stock maintains a 15.58% annual return over the last 12 months, supported by stable capacity expansion across its thermal and solar businesses. Institutional traders look forward to upcoming fundamental updates, as the company’s board is scheduled to meet on May 23, 2026, to review and approve the final standalone and consolidated annual financial results. The upcoming presentation is also expected to detail the formal recommendation for the final fiscal dividend layout.

Implications of Import Restrictions on the Valuation and Liquidity of Silver Investments
Bharat sarkar ne desh ke commodity market aur precious metals segment ke liye do bade aur ahem faisle kiye hain. Directorate General of Foreign Trade yani DGFT ne ek naya notification jaari kiya hai. Iske mutabik silver ke import ko 'Free' category se hata kar ab 'Restricted' category mein daal diya gaya hai. Iska matlab yeh hai ki ab koi bhi trader bina sarkar ke license ya authorization ke silver import nahi kar payega. Yeh faisla sarkar ke us kadam ke theek baad aaya hai jab precious metals par import duty ko chhai percent se badha kar seedhe pandrah percent kar diya ghar tha. Isme das percent basic customs duty aur paanch percent Agriculture Infrastructure and Development Cess shaamil hai. Sarkar ne yeh sakht kadam isiliye uthaya hai taaki UAE ke sath hue free trade agreement ke tahat duty-free ya kam duty par hone wale silver import ke arbitrage loophole ko poori tarah band kiya ja sake. Financial year do hazaar chhabis mein India ka silver import ek sau pachas percent badh kar baarah point zero paanch billion dollars par pahunch gaya tha. Is bhari jump ki vajah se desh ke foreign exchange reserves par lagatar dabaav ban raha tha. Naye niyamon ke mutabik yeh restriction sirf domestic market ke liye hai. Jo companies hundred percent Export Oriented Units hain ya jewellery export ke liye Advance Authorization ke tahat silver mangati hain unpar yeh naya niyam laagu nahi hoga. Is bade policy change ka sabse seedha asar silver investments aur iski pricing par dekhne ko milne wala hai. Import par pabandi aur unchi duty ki vajah se ab physical silver ki landed cost kafi badh jayegi. Is vajah se domestic market mein silver supply kam ho sakti hai jiski vajah se international prices ke muqable Indian market mein silver par milne wala premium kafi oopar chala jayega. Ab retail investors ko physical silver kharidne ke liye pehle ke muqable zyada keemat chukani padegi. Expert analysts ke mutabik ab aane wale dino mein MCX aur LBMA ka spread sabse ahem indicator hoga. International market mein spot silver is samay satasi point atharah dollars per ounce ke aaspaas trade kar raha hai. Wahin Multi Commodity Exchange yani MCX par silver futures contracts ke rates lagabhag do lakh sattanve hazaar nau sau rupees per kilogram ke levels par bane hue hain. Naye niyamon ke baad ab MCX par silver futures ke rates international prices se alag hokar ek naya aur bada premium dikha sakte hain. Is poore badlav ke chalte short term mein domestic market mein tezi dekhne ko mil sakti hai. Lekin unchi keematon ki vajah se retail demand par thoda asar padne ki bhi ummeed lagayi ja rahi hai.

PFC Board Approves Progress on REC Merger and Submits Proposal for Government Clearance
The structural consolidation of India's state-owned power financing sector has entered its next critical regulatory phase. The Board of Directors of Power Finance Corporation, or PFC, has formally approved advancing the mega-merger proposal with REC Limited to the Hon’ble President of India for final clearance. This board intervention marks a substantial escalation from the in-principle execution strategy outlined following the Union Budget. PFC has officially authorized its Chairman and Managing Director, Parminder Chopra, to navigate the presidential assent process, which remains a key structural mandate under the corporate Articles of Association. Once fully ratified, the transaction will absorb all underlying assets and liabilities of REC Limited into PFC, liquidating the former as a separate corporate listing. This mechanism will build a dominant, unified public non-banking financial profile controlling a massive combined loan book exceeding **₹17.3 lakh crore**, establishing one of the largest specialized power infrastructure financiers globally. The formal exchange architecture will be executed through a share-swap framework. Independent corporate valuers are being appointed to review operational books and compute the definitive exchange ratio for public shareholders. Indicative market estimates suggest a baseline swap ratio near **8 shares of PFC for every 9 shares of REC**. Maintaining the post-merger sovereign status of the consolidated enterprise remains a key focus for policy coordinators. Under standard corporate code equations, a direct market capitalization share-swap model risks diluting the central government's structural ownership below the critical **51%** mandatory benchmark, down toward the **42%** territory. To bridge this regulatory gap and preserve its public enterprise status, the merger framework outlines safeguards. The central government may execute a significant defensive capital infusion, initiate strategic share buybacks, or pursue legislative amendments to ensure the combined entity firmly retains its official status as a Government Company. Public capital markets are tightly monitoring the upcoming execution milestones. During recent trading sessions, equity shares of Power Finance Corporation fluctuated near the **₹445.75** threshold, while REC Limited equity shares adjusted to trade near **₹345.85**. Following the critical board decisions, PFC has extended the closure of its trading window for equity shares and listed debt securities until further orders. Market participants continue to price in long-term benefits from the elimination of overlapping lending pools, stronger pricing power, and enhanced capital efficiency to fund India’s Net Zero **2070** green energy targets.
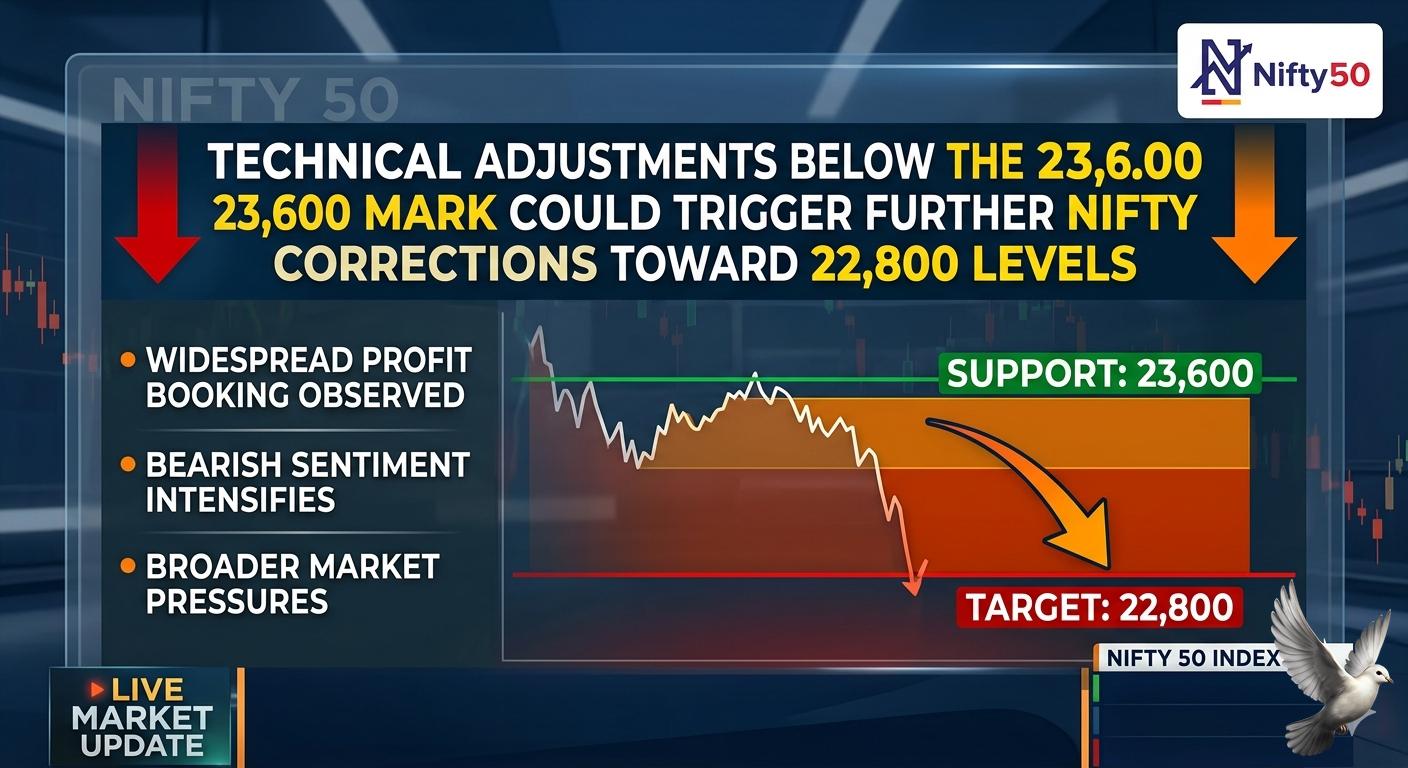
Technical Adjustments Below the 23,600 Mark Could Trigger Further Nifty Corrections Toward 22,800 Levels
The National Stock Exchange benchmark, Nifty **50**, has experienced a structured phase of profit booking, making the **23,600** zone a critical line in the sand for domestic technical analysts. Market data indicates that this price level serves as a foundational support wall. A decisive breach and sustained close below this threshold could accelerate downside momentum, exposing the index to a deeper corrective target near the **22,800** mark. Technical charting patterns reveal a highly complex and mixed setup. Short-term moving averages indicate a prevailing bearish bias, while daily momentum oscillators are hovering near oversold territory. This divergence suggests that while structural weakness remains intact, the market is highly susceptible to sudden, localized short-covering bounces. A primary drag on the benchmark index continues to be the Information Technology sector. The Nifty IT index has witnessed persistent institutional distribution, driven by cautious forward guidance from major software exporters and a slowdown in digital transformation spending across major Western geographies. Heavyweights within the sector are facing technical resistance at higher levels, capping broader market recovery attempts. In contrast to the broader cautious market sentiment, specific mid-cap and small-cap counters are displaying localized resilience and presenting selective long opportunities. Technical volume profiles highlight strong accumulation patterns in specialized textile player KPR Mill, which continues to trade comfortably above its short-term exponential moving averages. Concurrently, green energy and logistics player Refex Industries has displayed significant relative strength. The counter has successfully broken out of a multi-week consolidation pattern on expanding trading volumes, signaling robust underlying demand despite the defensive posture seen across the wider index. The broader market breath has turned moderately negative, with declining shares outnumbering advancing ones across consecutive trading sessions. Institutional capital is increasingly seeking shelter in defensive sectors like Fast-Moving Consumer Goods and Pharmaceuticals, while high-beta sectors like public sector banking and metal counters face selling pressure on every technical bounce. Traders are maintaining a highly defensive stance, adjusting leverage parameters to counter the elevated intraday volatility. Until the Nifty **50** establishes a stable base above the immediate resistance zone of **23,950**, the structural bias remains tilted toward the bears, leaving the crucial **23,600** support vulnerable to further retests.
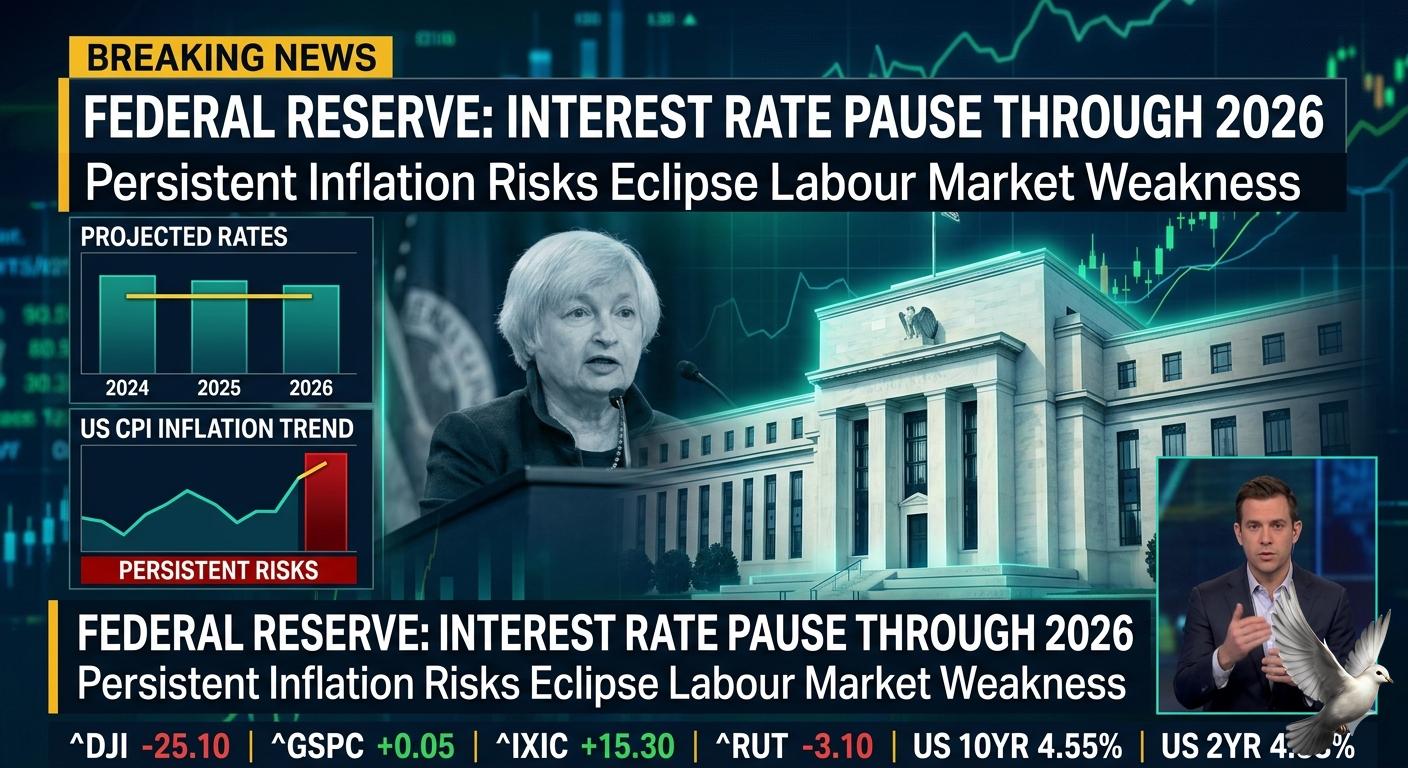
US Federal Reserve Projecting Interest Rate Pause Throughout 2026 as Persistent Inflation Concerns Eclipse Labour Market Moderation
The US Federal Reserve is structurally altering its monetary policy trajectory. Institutional research reports indicate that the central bank is highly likely to abandon its previous interest rate easing bias at the upcoming Federal Open Market Committee meeting. This pivot signals a strategic shift toward a prolonged tightening or holding stance extending through the calendar year. Macroeconomic modeling outlines a conditional escalating risk profile for fixed-income markets. Analysts highlight a **20%** probability of a **25 basis point** interest rate hike during the December policy meeting. This tightening scenario is contingent upon persistent supply-side shocks, specifically if strategic maritime chokepoints like the Strait of Hormuz experience extended closures, forcing global energy benchmarks to spike further. The broader shift in the Federal Reserve's policy framework is heavily influenced by stubborn consumer price trajectories. While components of the domestic labor market have shown signs of subtle moderation and cooling, stickier structural inflation dynamics continue to eclipse employment concerns. This forced co-existence of high pricing pressures and softening job metrics has complicated the central bank's path toward dual-mandate stabilization. Global bond and equity markets are already pricing in this higher-for-longer interest rate scenario. The benchmark US **10-year** Treasury yield has climbed significantly, consolidating near the **4.55%** threshold. Concurrently, the **2-year** Treasury yield, which remains highly sensitive to immediate central bank policy shifts, has pushed upward to trade near **4.88%**, reflecting market expectations that interest rate cuts are completely off the table for the foreseeable future. This domestic fixed-income adjustment has injected substantial momentum into foreign exchange clearing matrices. The US Dollar Index, which measures the greenback against a basket of six major global currencies, has strengthened considerably to test the **106.30** mark. A stronger dollar continues to exert compounding pressure on emerging market asset classes and cross-border capital flows. On the domestic equity front, major tracking benchmarks are navigating increased volatility as institutional portfolios recalibrate for sustained high borrowing costs. The S&P 500 index recently pulled back to negotiate support near the **5,120** level, while the tech-heavy Nasdaq Composite has felt the brunt of escalating yields, retreating toward the **16,100** mark. Higher structural interest rates are also altering corporate credit dynamics. High-yield corporate bond spreads have begun to widen slightly as refinancing risks rise for leveraged corporate balance sheets. Industrial commodities are displaying divergent trends, with gold retaining a geopolitical risk premium near **$2,350 per ounce**, while international Brent crude trades firmly above **$84 per barrel** on localized supply anxieties.
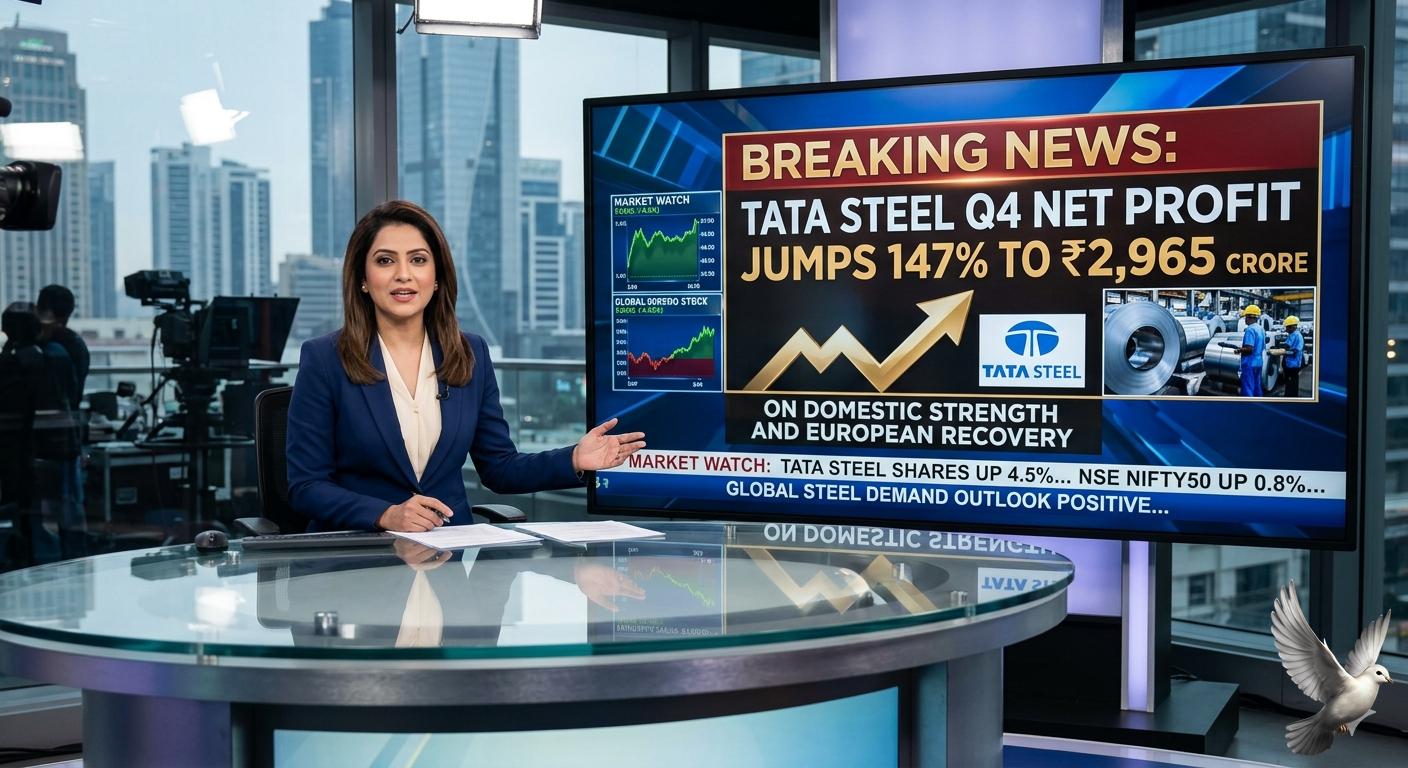
Tata Steel Q4 Net Profit Jumps 147% to ₹2,965 Crore on Domestic Strength and European Recovery
Tata Steel has registered a significant acceleration in its financial performance, driven primarily by strong domestic delivery volumes and a recovery across its European operational footprint. For the final quarter ending March 31, the company reported a consolidated net profit of **₹2,965 crore**. This milestone represents a substantial **147%** year-on-year surge from the **₹1,200.88 crore** net profit recorded during the corresponding quarter of the previous financial year. The steel major's top-line performance mirrored this upward trajectory. Consolidated revenue from operations grew **12.54%** to stand at **₹63,270.13 crore**, compared to **₹56,218.11 crore** in the year-ago period. This operational momentum pushed the company's operating earnings before interest, taxes, depreciation, and amortization up by nearly **50%** to **₹9,828.66 crore**, successfully expanding consolidated operating margins by **386 basis points** to **15.53%**. On a full-year structural basis, the company\'s annual net profit surged over threefold to reach **₹10,885.82 crore**, highlighting a strong recovery loop from the **₹3,173.78 crore** posted during the previous annual period. Backed by this robust cash generation, the board has recommended an equity dividend of **₹4 per share** for the fiscal period, involving a total cash payout that reflects the business's improved operating health. The domestic market remained the core engine of corporate profitability. Revenue from Indian operations climbed to **₹38,447.96 crore**, supported by record annual volume deliveries of **22.5 million tonnes** and a richer high-margin downstream automotive product mix. Concurrently, regional subsidiaries like Neelachal Ispat and associated domestic arms generated more than **₹6,604 crore** in baseline quarterly revenue. The company's overseas profile yielded a mixed performance. The Netherlands division demonstrated a visible recovery, pushing quarterly revenues to **₹17,016 crore** and nearly tripling its annual operating profit. Conversely, the United Kingdom operations, which are currently undergoing an aggressive asset-restructuring and green steel technology transition, recorded a minor revenue dip to **₹5,774.44 crore** alongside localized demand contraction. Despite the strong earnings execution, corporate leadership highlighted expanding macroeconomic risks moving into the next fiscal period. Heightened geopolitical disruptions in West Asia are beginning to squeeze international supply chains and drive up critical raw input costs. Furthermore, the business continues to navigate intense environmental compliance friction in Europe. The Netherlands operating site has faced more than **€20 million** in emissions penalties and is managing a complex regulatory dialogue surrounding stricter domestic slag disposal standards and potential operating permit revocations, requiring the company to pursue structured mitigation strategies to protect its international margins.
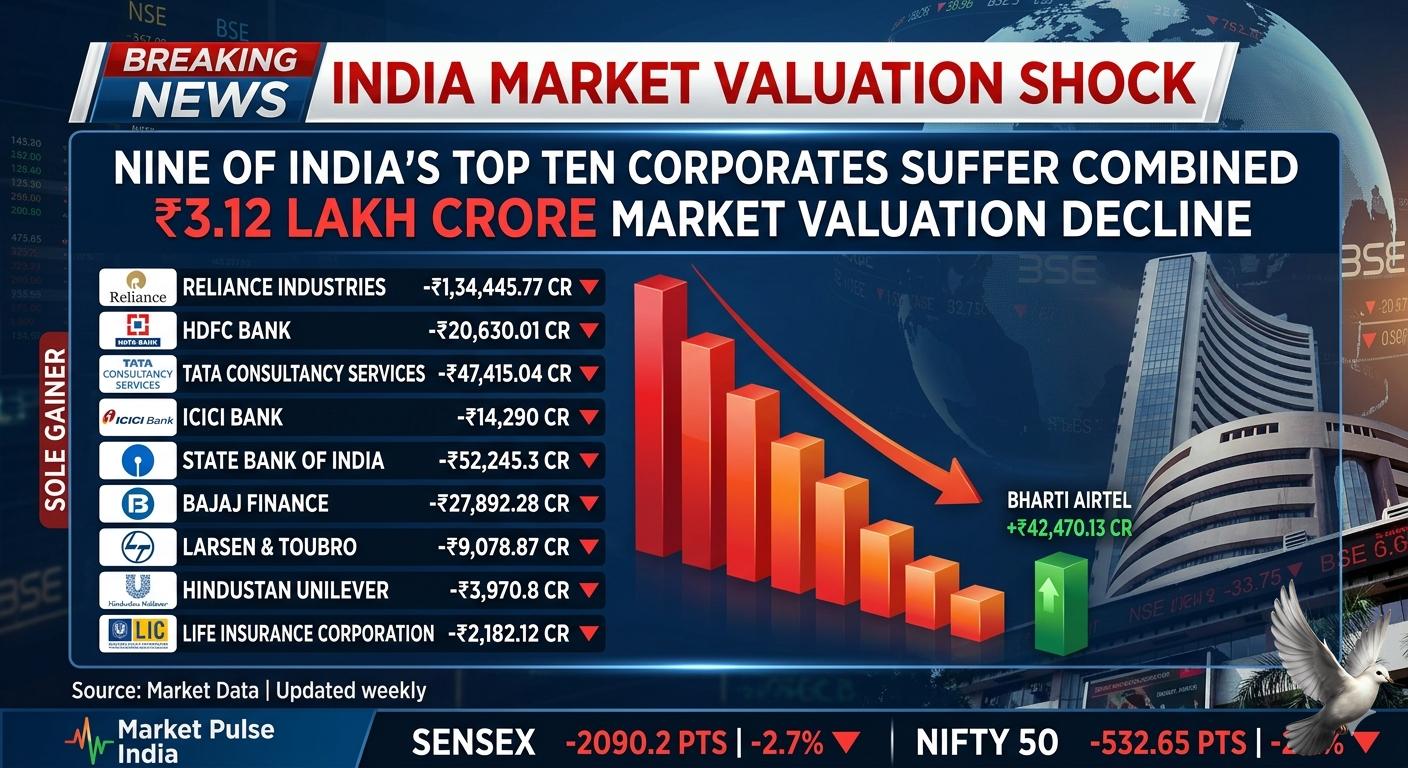
Nine of India's Top Ten Corporates Suffer Combined ₹3.12 Lakh Crore Market Valuation Decline Leading Corporate Losses
India’s prominent corporate entities have experienced a sharp contraction in equity valuations, pulling back from previous consolidation phases. Over the most recent weekly tracking period, nine of the top ten most valued enterprises on domestic exchanges collectively shed **₹3.12 lakh crore** in total market capitalization. This rapid value erosion aligned with a broader market downturn. The **30-share** BSE Sensex plummeted by **2,090.2 points**, or **2.7%**, while the benchmark **50-share** NSE Nifty dropped **532.65 points**, or **2.2%**. This downturn followed persistent geopolitical friction in West Asia, a weakening rupee, and rising imported cost concerns as crude benchmarks moved past **$105 per barrel**. Reliance Industries bore the heaviest brunt of the large-cap sell-off. The conglomerate’s market capitalization tumbled by **₹1,34,445.77 crore**, pulling its total valuation down to **₹18,08,420.81 crore**. Banking and financial majors also faced significant institutional selling pressure. State Bank of India's valuation eroded by **₹52,245.3 crore** to settle at **₹8,88,862.32 crore**. Concurrently, private lending giant HDFC Bank registered a notable drop, while ICICI Bank also pulled back to finish the tracking week at a valuation of **₹8,92,385.39 crore**. The technology and non-banking financial segments saw deep adjustments. The market valuation of Tata Consultancy Services tanked **₹47,415.04 crore**, lowering its market capitalization to **₹8,19,062.65 crore**. Meanwhile, consumer finance giant Bajaj Finance dived **₹27,892.28 crore**, dragging its total equity value down to **₹5,66,717.74 crore**. Minor losses were recorded across the engineering, consumer goods, and insurance heavyweights. Larsen & Toubro's market cap edged down to settle at **₹5,37,542.34 crore**, while consumer giant Hindustan Unilever closed at **₹5,33,592.18 crore**. The Life Insurance Corporation of India mirrored this minor retreat, sliding to **₹5,05,367.32 crore**. Bucking the broad bearish trend, telecom leader Bharti Airtel emerged as the sole gainer in the top-ten hierarchy. The company’s valuation jumped by **₹42,470.13 crore**, elevating its total market capitalization to **₹11,60,525.16 crore**. Following these structural valuation shifts, Reliance Industries retains its position as India’s most valued corporation. It is followed in descending order by HDFC Bank, Bharti Airtel, ICICI Bank, State Bank of India, TCS, Bajaj Finance, Larsen & Toubro, Hindustan Unilever, and LIC.
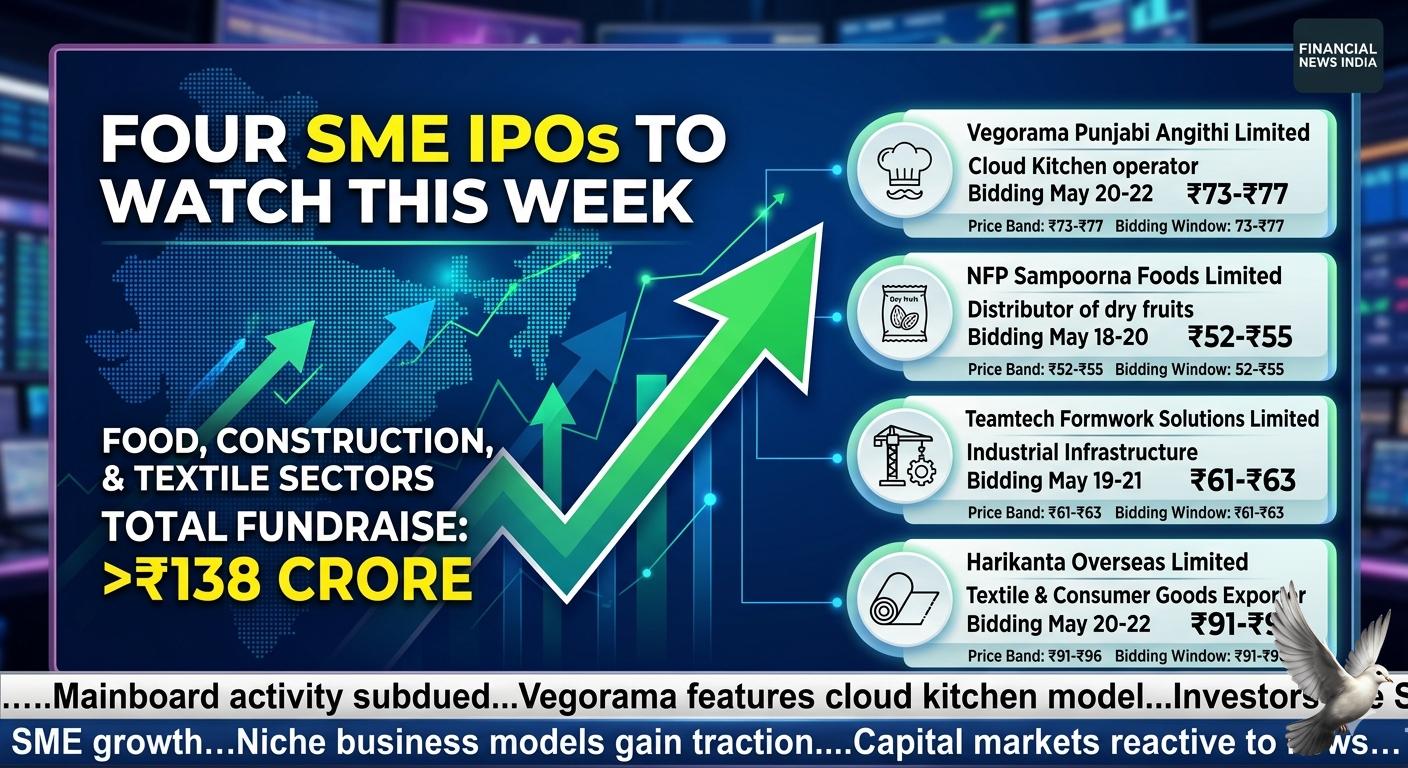
Four SME Public Issues Worth Over ₹138 Crore Set to Open This Week on Indian Exchanges
The primary market segment for Small and Medium Enterprises (SMEs) is experiencing a notable rise in momentum. A fresh cluster of public offerings is launching this week, collectively seeking to raise more than **₹138 crore**. This robust pipeline contrasts sharply with a temporarily subdued phase for larger mainboard corporate listings. The upcoming pipeline spans a variety of defensive and consumer-oriented business models. Leading the week’s activity is Vegorama Punjabi Angithi Limited, a specialized vegetarian food brand that originally developed as a cloud kitchen franchise before expanding into dine-in and corporate catering operations. The company is hitting the capital market with a book-built issue worth **₹38.38 crore**, setting an initial price band of **₹73** to **₹77** per share. The bidding window opens on May 20 and closes on May 22, requiring a minimum retail application ticket size of **3,200 shares** at a total investment value of **₹2,46,400**. Proceeds from the cloud kitchen operator’s public issue are structurally earmarked to fund aggressive expansion. The company plans to allocate **₹11.82 crore** for building a dedicated banquet and fine-dining infrastructure, **₹4.27 crore** toward a new centralized kitchen facility, and **₹4.93 crore** for rolling out additional geographic cloud kitchen hubs to tap into the expanding food delivery market. Joining the digital food platform on the primary market schedule is NFP Sampoorna Foods Limited, an established distributor of dry fruits and premium agricultural products. The company's bidding window opens on May 18 and closes on May 20, offering equity within a fixed price band of **₹52** to **₹55** per share. Retail participants can enter bids with a minimum lot allocation of **2,000 shares**. Additionally, the construction and industrial infrastructure segment will see new supply with the listing of Teamtech Formwork Solutions Limited. The public offering is scheduled to take subscriptions between May 19 and May 21, establishing a narrow price band of **₹61** to **₹63** per share with a minimum bidding requirement of **2,000 shares**. Rounding out the active pipeline is Harikanta Overseas Limited, an exporter operating in the textile and consumer goods segment. The subscription window for this issue matches the food brand's timeline, running from May 20 to May 22 with an equity price band of **₹91** to **₹96** per share and a minimum order quantity of **1,200 shares**. The broader investment trend shows strong retail and institutional interest within these niche structural plays. Capital market participants are closely evaluating cash flow allocations, as the majority of these upcoming offerings consist primarily of fresh equity issuance intended to strengthen working capital cycles, clear legacy corporate debts, and scale localized retail operations.
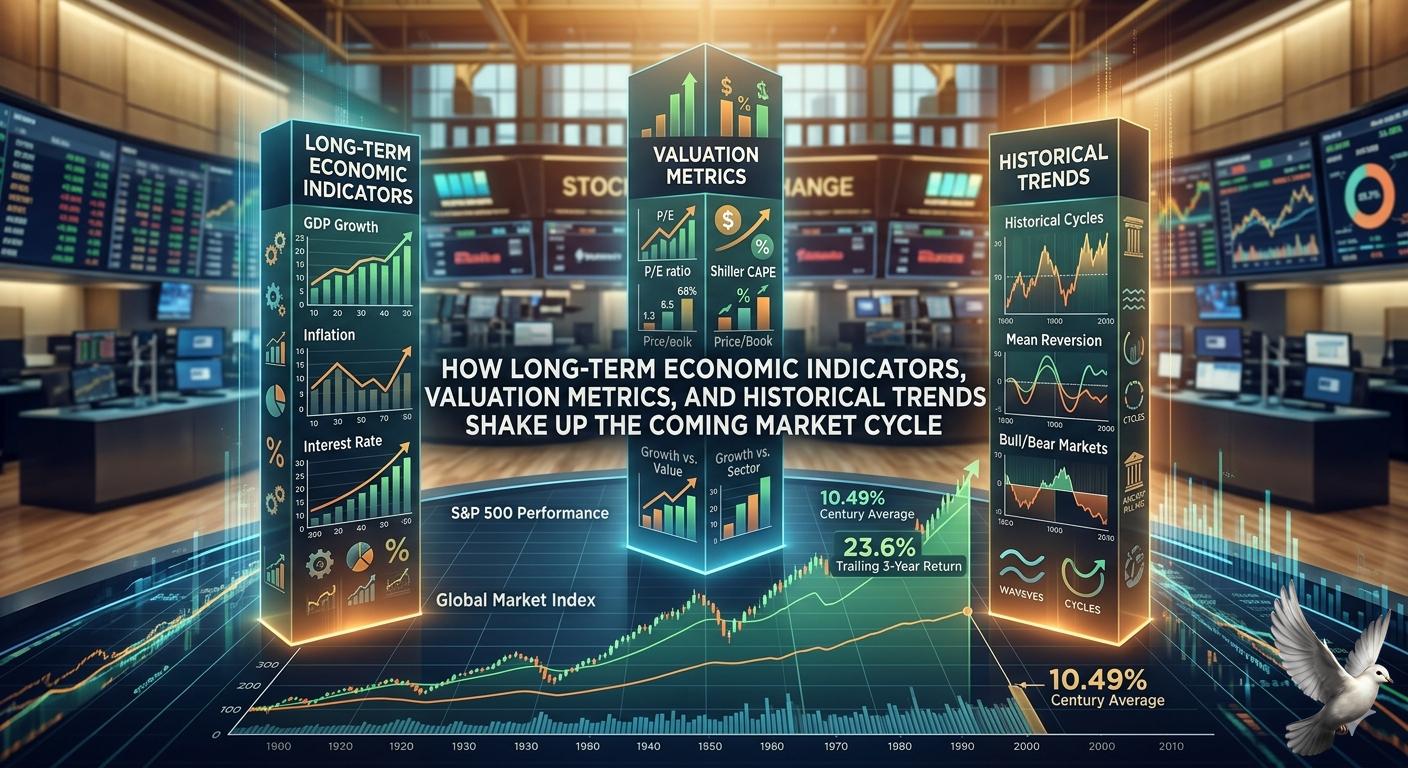
How Long-Term Economic Indicators, Valuation Metrics, and Historical Trends Shake Up the Coming Market Cycle
Global equity markets are moving through a phase of historically elevated valuations, driven heavily by concentrated capital allocation in the technology sector. The S&P 500 continues to trade at a premium, carrying a forward price-to-earnings multiple of roughly **21 times**. This valuation rests within the upper **13%** of its historical range over the past **40 years**, underscoring a high-conviction, risk-on environment. A massive driver behind these elevated metrics is the continuous capital deployment into artificial intelligence infrastructure. The largest cloud computing and technology companies are projected to spend a collective **$670 billion** in capital expenditures. This massive infrastructure investment is expected to fuel approximately **40%** of the S&P 500 earnings-per-share growth, prompting a hyper-focused rally where a small basket of mega-cap technology firms commands outsized weight. However, this valuation divergence has triggered a renewed focus among institutional investors on the mechanics of mean reversion and value-oriented asset allocation. Historically, the S&P 500 has delivered an annualized return of **10.49%** over the last century. In stark contrast, trailing three-year annual returns have surged to **23.6%**, creating an overextended performance gap that typically precedes long-term corrections back toward historical averages. This extreme performance disparity has created unique opportunities outside the primary U.S. indexes. While the MSCI World Growth Index has significantly outperformed its value counterpart over a **10-year** horizon with a **295.6%** return compared to **166.5%**, the gap has narrowed dramatically. Over a **5-year** lookback period, global growth and value indices are neck-and-neck, returning **63.2%** and **62.4%** respectively. Geographically, a major structural shift is taking place. When stripping out U.S. mega-cap tech stocks, value investing has emerged as the clear leader across international regions, outperforming growth in Europe, Asia, Latin America, and the broader emerging markets. In particular, sectors heavily represented in value benchmarks, such as financials, defense, and industrials, are drawing capital as steeper yield curves support earnings expectations. As a result, asset managers are managing expectations downward for passive benchmarks over the next decade. Long-term forecasting models project the Global Market Index to achieve an annualized return of just over **7%**, a noticeable deceleration from its **9%** annualized trailing ten-year performance. This shifting climate underscores the importance of portfolio discipline and contrarian strategies as cyclical rotations begin to test the persistence of growth-heavy portfolios.
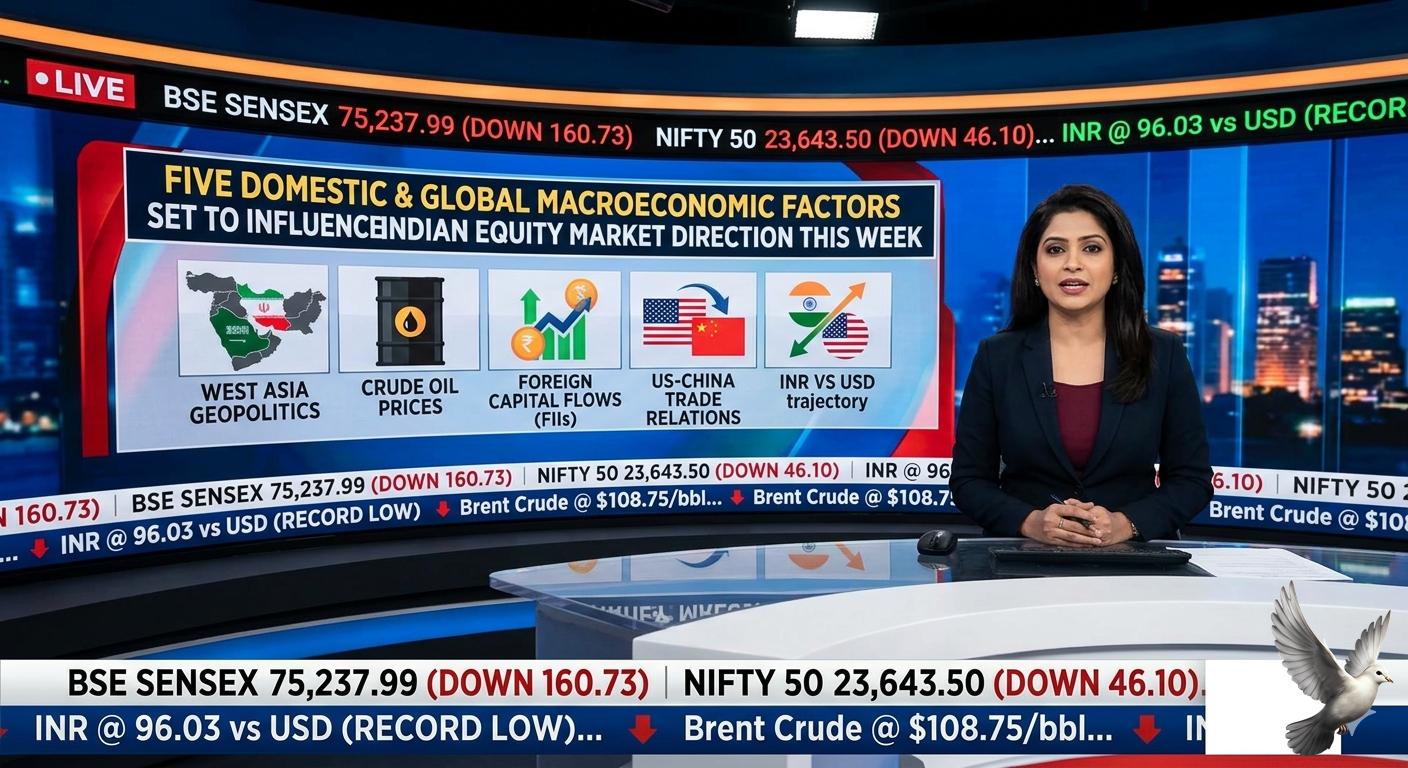
Five Domestic and Global Macroeconomic Factors Set to Influence Indian Equity Market Direction This Week
Indian equity benchmarks concluded a volatile trading week with notable losses, reversing prior recovery attempts as major global and domestic macroeconomic pressures converged. Over the course of the week, the BSE Sensex fell by approximately **2,000 points**, while the NSE Nifty 50 recorded a weekly drop of roughly **2%**. On the final trading session of the week, early gains driven by a selective rally in information technology and pharmaceutical stocks were entirely erased by late-afternoon selling in financial and metal counters. The Nifty 50 slipped **46.10 points**, or **0.19%**, to settle at **23,643.50**, while the BSE Sensex declined by **160.73 points**, or **0.21%**, to close at **75,237.99**. A primary trigger forcing defensive positioning across Dalal Street is the ongoing depreciation of the local currency. The Indian rupee fell to a fresh historic low, weakening past the psychological threshold to touch **96.03** against the US dollar. Currency depreciation continues to amplify fiscal concerns regarding imported cost inflation, directly impacting corporate margins. The pressure on the local currency is closely linked to escalating global energy costs. Driven by direct supply risk anxieties surrounding the US-Iran geopolitical friction and the ongoing closure of the Strait of Hormuz, global oil benchmarks surged by approximately **5%** over the week. Brent crude futures jumped past **$107 per barrel**, while closing the week trading towards **$109 per barrel**. This steep energy appreciation prompted state-run oil marketing companies to implement a fresh fuel price hike, raising both petrol and diesel prices by **₹3 per litre** nationwide. The sudden tariff revision, the first major fuel price increase in nearly four years, has immediately revived broader consumer inflation concerns across domestic retail and logistics ecosystems. Market sentiment is expected to remain guarded and highly reactive to headline updates moving into the upcoming sessions. Trading direction will be heavily dictated by five primary factors: developments in the West Asia conflict, international crude pricing structures, foreign institutional capital flows, international trade discussions between the United States and China, and the trajectory of the rupee against a strengthening US dollar.
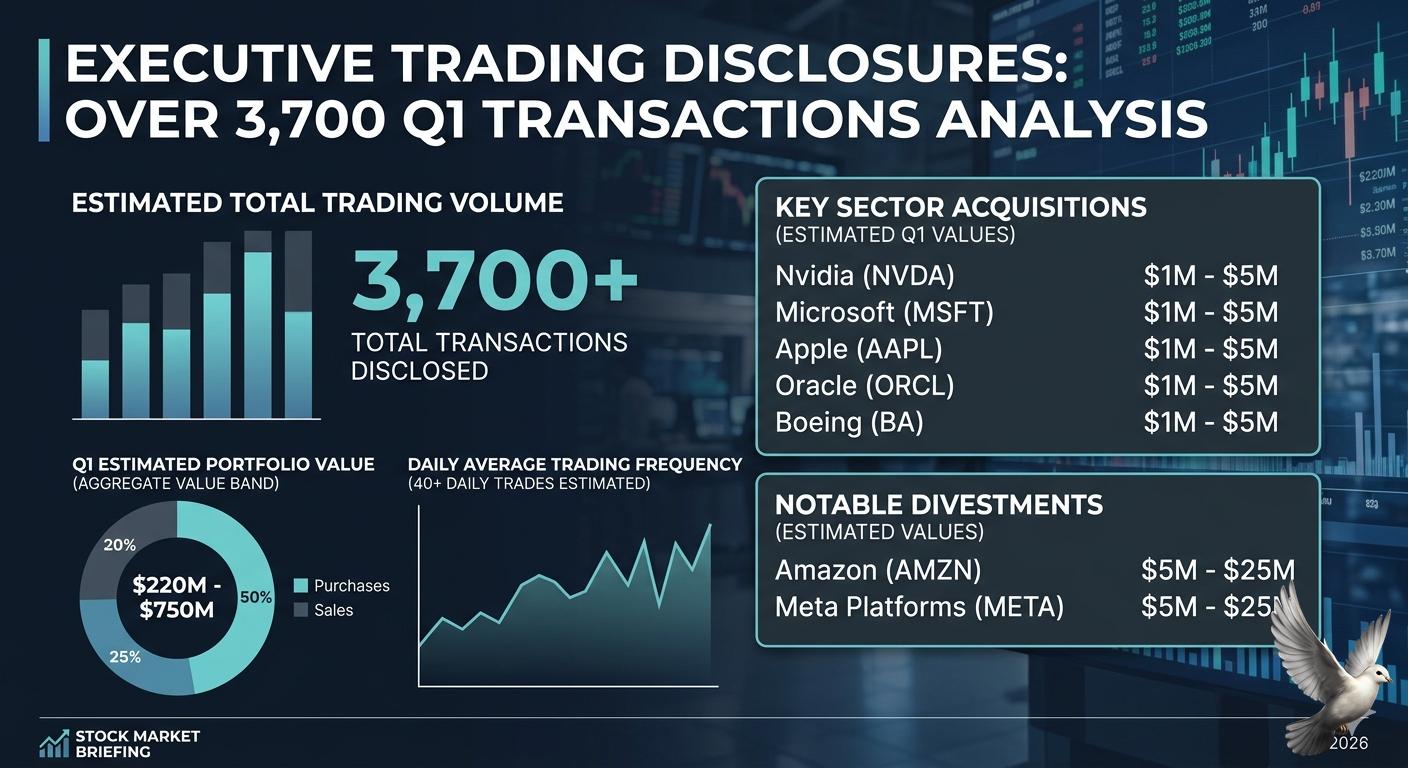
Donald Trump's Public Financial Disclosures Detail Over 3,700 Trading Transactions
The U.S. Office of Government Ethics (OGE) has published financial disclosure reports outlining high-volume trading activity linked to President Donald Trump. The **113-page** filing reveals that **3,642 transactions** were recorded during the first quarter of **2026**. The cumulative estimated value of this activity spans between **$220 million** and **$750 million**. The trading volume averaged more than **40 transactions per day** across the three-month period, involving a mix of high-profile corporate securities and municipal bonds. Market analysts note that the sheer frequency and scale of the transactions closely align with institutional algorithmic trading models rather than typical personal portfolio allocations. The disclosures show acquisitions of at least **$1 million** to **$5 million** each in prominent technology and defense entities, including Nvidia, Apple, Oracle, Microsoft, and Boeing. A significant portion of the capital flow centered on policy-sensitive sectors. Large-scale divestments occurred on February 10, when positions in Microsoft, Meta Platforms, and Amazon were reduced by amounts between **$5 million** and **$25 million**. Conversely, capital was rotated into financial institutions and infrastructure assets, including Goldman Sachs, Bank of America, and cryptocurrency-related fintech firms like Robinhood and MARA Holdings. The transactional breakdown indicates that **2,346 securities** were purchased while **1,296** were sold. Because public officials report transactions using broad value bands rather than specific execution prices, an exact assessment of total net profit or loss remains undetermined. The Trump Organization clarified that the underlying portfolios are structured as fully discretionary accounts. These assets are managed independently by third-party financial institutions with exclusive authority over investment decisions, meaning the administration has no direct involvement or advance knowledge of specific trades. The mandated ethics filings were submitted across periodic transactional disclosure reports, missing the standard federal reporting timeline. National transparency rules require public officials to report transactions exceeding **$1,000** within **45 days** of execution. Automated late filing penalties of **$200** per delayed report were assessed and settled. A separate, comprehensive annual financial disclosure detailing global business assets, real estate holdings, and digital asset valuations has been granted a **45-day** extension and is expected to follow in the coming months. *** [Trump's Q1 Stock Disclosure Analysis](https://www.youtube.com/watch?v=PWfmD6xCjZs) This video provides an in-depth breakdown of the asset sequencing and broader transaction trends detailed across the executive branch's latest multi-million dollar portfolio filings.
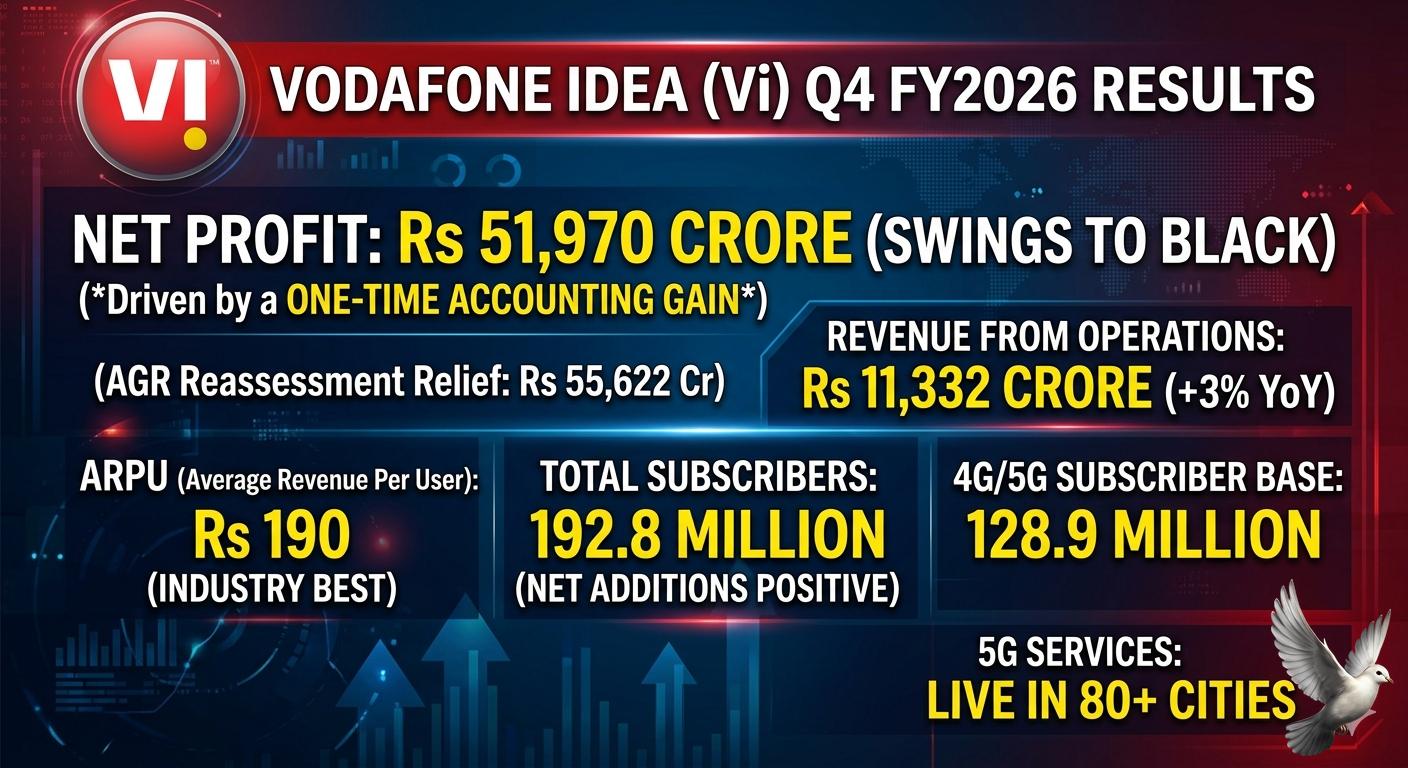
Vodafone Idea Reports Q4 Profit of Rs 51,970 Crore on One-Time Gain as Revenue Rises 3% YoY
Vodafone Idea has executed a major financial turnaround for the final quarter of the 2026 fiscal year. The telecom operator swung to black, printing a consolidated net profit of 51,970 crore rupees. This dramatic reversal from a loss of 7,167 crore rupees in the same period last year was driven by a massive statutory relief. The Department of Telecommunications finalized the company's adjusted gross revenue liabilities downward to 64,046 crore rupees, sparking a one-time accounting gain of 55,622 crore rupees in the earnings statement. Excluding this exceptional item, the underlying quarterly loss narrowed to 5,515 crore rupees. Operationally, top-line performance surpassed general market expectations. Revenue from operations climbed 2.9% year-on-year to reach 11,332 crore rupees, supported by tariff stabilization and data migration. Annual revenue for the full fiscal year grew 3% to touch 43,571 crore rupees, while annual earnings before interest, taxes, depreciation, and amortisation expanded 4.8% to 19,003 crore rupees. Critical subscriber and network metrics showed concrete recovery. Average revenue per user, excluding machine-to-machine connections, jumped to 190 rupees per month from 175 rupees in the previous year. Crucially, the long-standing trend of customer churn has stabilized. Total subscribers settled at 192.8 million, with monthly user net additions officially turning positive starting February 2026. The 4G and 5G consumer segment expanded to 128.9 million, bolstered by a 12% boost in data capacity and an infrastructure rollout extending 4G coverage to an extra 48 million people. Capital expenditures and balance sheet optimization are reshaping the company's outlook. Bank debt dropped significantly to 726 crore rupees by the close of March, down from 2,326 crore rupees the previous year. Furthermore, the company expanded next-generation connectivity by making 5G services active in over 80 cities across 17 telecom circles. Fresh funding pipelines are also materializing to support future network expansion. The promoter group, Aditya Birla Group, committed to a capital injection of 4,730 crore rupees through fully convertible warrants to provide further operational runway.

XED to Launch GIFT City’s First IPO of $12 Million on March 6
Executive education provider XED Executive Development has confirmed the pricing and timeline for its landmark Initial Public Offering at GIFT City. This transaction represents a historic shift for India’s International Financial Services Centre (IFSC) as it hosts its first-ever equity share sale. The company has set a price band of **USD 10 to USD 10.5** per share. The issue aims to raise a total of **USD 12 million** to fuel global expansion. The subscription window is scheduled to open on **March 6, 2026**, and will remain active for nine working days, closing on **March 18, 2026**. This dollar-denominated offering marks a significant evolution for the Gujarat International Finance Tec-City ecosystem. While the zone has previously focused on debt and derivatives, this move introduces a primary equity market for globally oriented companies. The shares will be listed on both the **NSE International Exchange (NSE IX)** and the **India International Exchange (India INX)**. Participation is restricted to eligible investors under the International Financial Services Centres Authority (IFSCA) framework. This includes Non-Resident Indians (NRIs), foreign portfolio investors (FPIs), and institutional participants. Because the instrument is traded in US dollars, it provides international investors with a hedge against currency volatility and aligns with global valuation standards. XED currently operates across more than **25 countries**, with a strong presence in the Middle East, Southeast Asia, North America, and India. The capital raised is earmarked for deepening university partnerships and scaling delivery infrastructure across these high-growth regions. The launch comes at a time of high activity for GIFT City. The International Financial Services Centre has seen banking assets exceed **USD 100 billion**, while monthly exchange turnovers average **USD 90 billion**. Market experts view this IPO as a critical test for the IFSC’s offshore capital-raising platform, which could pave the way for other cross-border enterprises. The broader market context remains cautious but resilient. The **GIFT Nifty** has recently traded in a range-bound zone near **25,500–25,700**, reflecting a phase of consolidation. Despite global tech volatility, domestic institutional buying remains a strong support pillar for the ecosystem. Key entities managing the issue include **Global Horizon Capital Advisors** as the lead manager and **KFin Technologies** as the registrar. Banking operations for the IPO are being handled by **DBS Bank** and **RBL Bank**.
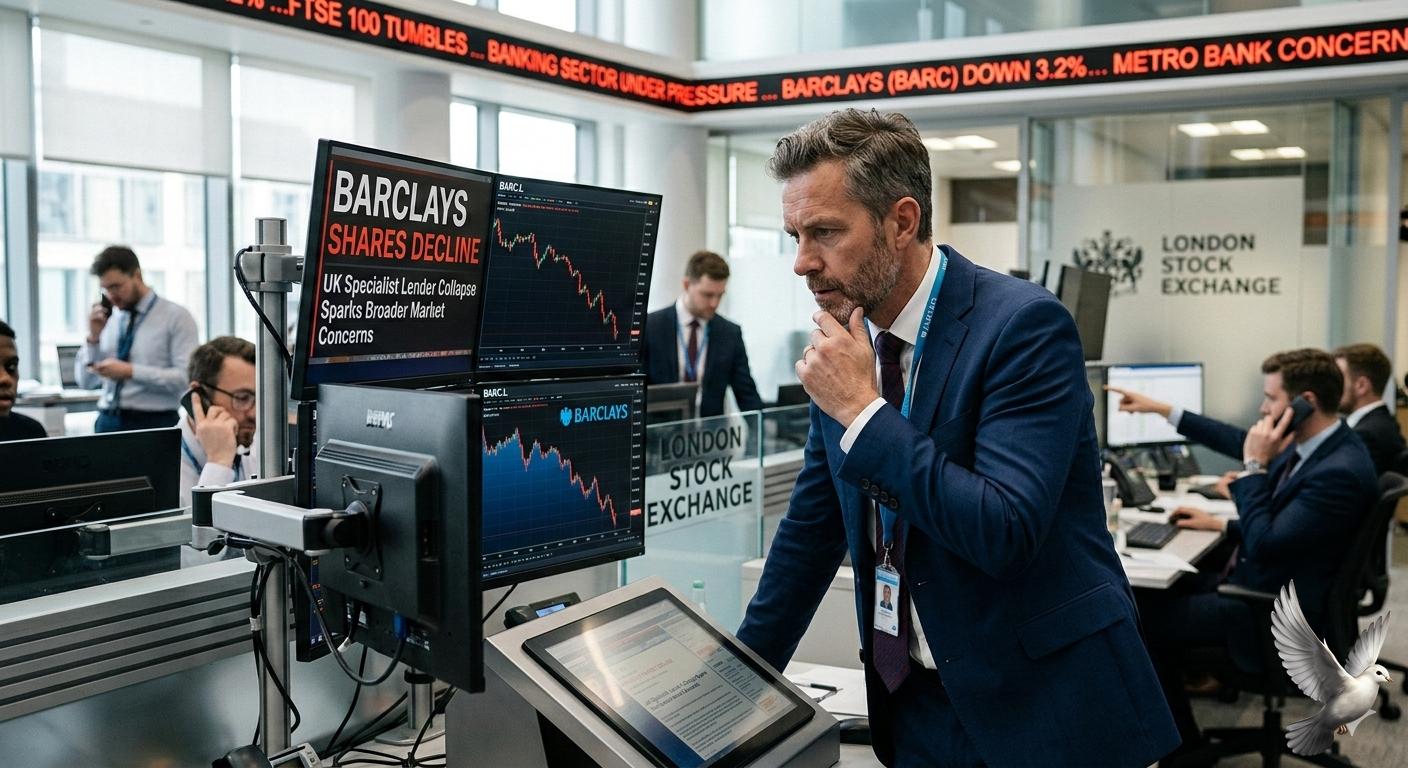
Barclays Shares Decline Amid Market Concerns Following UK Specialist Lender Collapse
**Market Brief: Barclays and the UK Private Credit Sector** Barclays shares faced significant pressure during Friday's trading session following reports of a 600 million pound exposure to the collapse of Market Financial Solutions (MFS). The specialist UK mortgage provider and bridging lender entered administration this week amid allegations of financial irregularities and fraud. The bank's stock price slid 4.2% on Friday to close at approximately 451.35p. This decline occurred despite the broader FTSE 100 index reaching a record high of 10,910.55 points. The sell-off reflects investor anxiety regarding the quality of underwriting standards in the fast-growing private finance and "shadow banking" sectors. **Exposure and Financial Impact** The collapse of MFS has triggered immediate scrutiny of institutional lending lines. Court proceedings revealed allegations of "double pledging" of assets, a practice where the same collateral is used to secure multiple loans. Barclays and Atlas SP Partners are identified as major creditors, having arranged portions of a lending facility that once supported an MFS loan book valued at 2.4 billion pounds. While Barclays has recently reported strong annual earnings and a 1 billion pound share buyback program, this latest development introduces a potential 600 million pound loss. Analysts are currently evaluating how much of this exposure is already provisioned or held on the bank's balance sheet versus external investment vehicles. **Wider Sector Concerns** The fallout has impacted other lenders with similar private credit exposures. Shares in Jefferies dropped 10%, while Santander also saw declines as the market reassessed risk positions in structured mortgage funding. This incident follows the recent insolvency of another bridging lender, Century Capital, suggesting a localized tightening in the specialist finance market. The UK bridging sector, which provides short-term property loans, operates with less regulatory oversight than mainstream retail banking. These high-profile failures have validated recent warnings from industry leaders regarding "cockroaches" in the credit market and the risks associated with non-bank lenders stretching standards to maintain income growth. **Market Outlook and Indicators** The broader UK economic environment remains complex. The Bank of England recently maintained the base rate at 3.75%, though market expectations lean toward further cuts later this year. While mortgage lending growth is forecast to slow to 2.5% in 2026, the demand for higher-yield private credit had remained robust until these recent defaults. Investors are now pivoting toward a more cautious "interpretation game." While Barclays’ Common Equity Tier 1 (CET1) ratio remains healthy at 14.1%, the MFS collapse serves as a critical test of the bank’s risk management frameworks within its investment and corporate banking divisions. Expect increased focus on collateral verification and more stringent due diligence across all private lending facilities in the coming months.

Sunway Healthcare Files Prospectus for IPO of Up to $736 Million
Sunway Healthcare Holding launched its initial public offering (IPO) prospectus on Friday, February 27, 2026. The group aims to raise up to 2.86 billion ringgit, approximately 736 million dollars. This move positions the company for the largest market debut in Malaysia since 2017. The offering consists of 1.97 billion shares priced at 1.45 ringgit each. The retail subscription window is officially open from today until March 5, 2026. Trading is expected to commence on the Main Market of Bursa Malaysia on March 18, 2026. Upon listing, the company’s market valuation is projected to reach 16.7 billion ringgit. This listing will increase the total market capitalization of the Sunway Group’s four listed units to over 70 billion ringgit. The IPO has secured backing from 20 cornerstone investors, including the Employees Provident Fund and JPMorgan Asset Management. Proceeds from the listing are earmarked for major infrastructure and clinical enhancements. Approximately 66.5 percent, or 554 million ringgit, will fund the expansion of existing hospitals over the next 36 months. Another 29.9 percent is allocated to the redemption of sukuk wakalah. Sunway Healthcare enters the market following a record financial performance. In 2025, the parent group reported a net profit of 1.3 billion ringgit, a 13 percent increase from the previous year. The healthcare division specifically saw a 44.7 percent jump in pre-tax profit to 96.9 million ringgit, fueled by rising patient volumes and higher bed occupancy. The timing of the IPO coincides with a broader push for larger listings in Malaysia. Bursa Malaysia is targeting a total IPO market capitalization of 28 billion ringgit for 2026. This follows a robust 2025 where 60 companies went public, raising 2.36 billion dollars. The regional healthcare outlook remains a primary driver for the expansion. Malaysia’s medical inflation is projected to reach 16 percent in 2026, the highest rate since 2021. This trend is attributed to an aging population, the adoption of advanced medical technologies, and a growing demand for private healthcare services. Sunway Healthcare currently operates 1,805 licensed beds as of early 2026. The group aims to double this capacity by 2032. It also maintains a 30 percent dividend payout policy, positioning itself as a high-conviction play for investors seeking both growth and recurring income in a defensive sector.
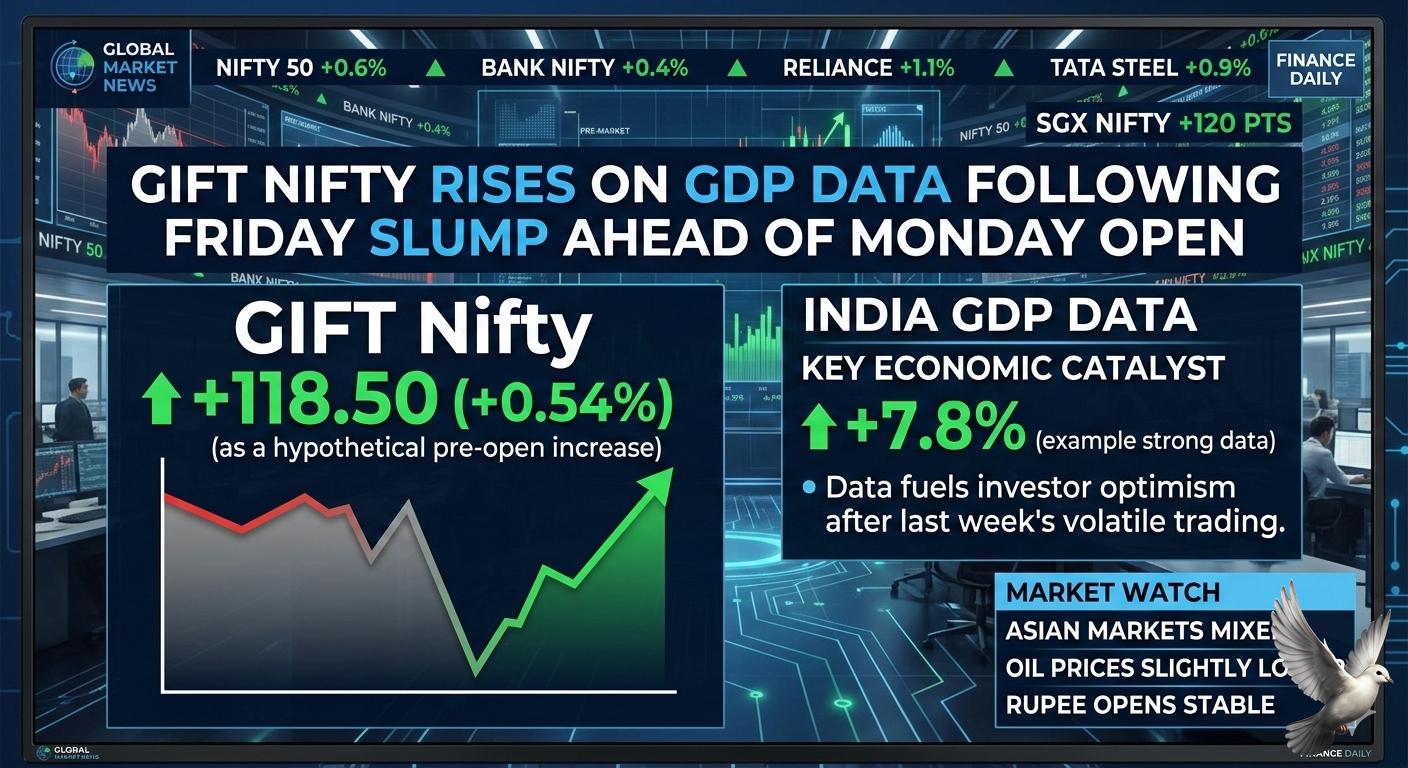
GIFT Nifty Rises on GDP Data Following Friday Slump Ahead of Monday Market Open
Indian equity markets faced a significant sell-off today, February 27, 2026, as the BSE Sensex plummeted 961 points to close at 81,287.19. The NSE Nifty 50 also suffered a sharp decline, sliding 318 points to settle at 25,178.65. This downward move represents a drop of over 1.2% for both benchmark indices. The correction was fueled by fresh foreign fund outflows and mounting geopolitical risks. Investor confidence wavered as U.S.–Iran nuclear talks stalled, raising fears of escalated tensions in the Middle East. Additionally, uncertainty surrounding AI-sector valuations in the U.S. triggered a global "risk-off" sentiment, dragging down Asian and European peers. Foreign Institutional Investors (FIIs) remained in selling mode, offloading equities worth 3,465 crore in the latest session. However, the impact was partially cushioned by Domestic Institutional Investors (DIIs), who showed resilience by purchasing stocks worth 5,031 crore. This domestic support remains a critical anchor for Indian markets during global turbulence. Despite the market volatility, India’s fundamental economic indicators remain robust. The latest government data shows that the economy grew at a better-than-expected 7.8% in the third quarter of the current fiscal year. This performance has led to an upward revision of the full-year GDP growth projection for 2025-26 to 7.6%. The manufacturing and services sectors have emerged as the primary engines of this resilience, both recording growth rates above 9%. While the broader market cap saw a erosion of nearly 5 lakh crore today, the upbeat GDP signals suggest a solid domestic foundation that could support a recovery once global headwinds subside. Sectoral performance was largely negative, with heavy selling observed in the Auto, Banking, and Realty spaces. Major laggards included Sun Pharma, Mahindra & Mahindra, and Bharti Airtel. Conversely, the IT sector provided a rare bright spot, with stocks like HCL Tech and Infosys ending in the green as investors rotated into defensive plays. Volatility, as measured by the India VIX, remains around the 13.06 level, indicating that while there is pressure, there is no immediate panic. Market participants are now closely watching the 25,100–25,200 support zone for the Nifty, as technical indicators suggest the index is entering a critical consolidation phase.
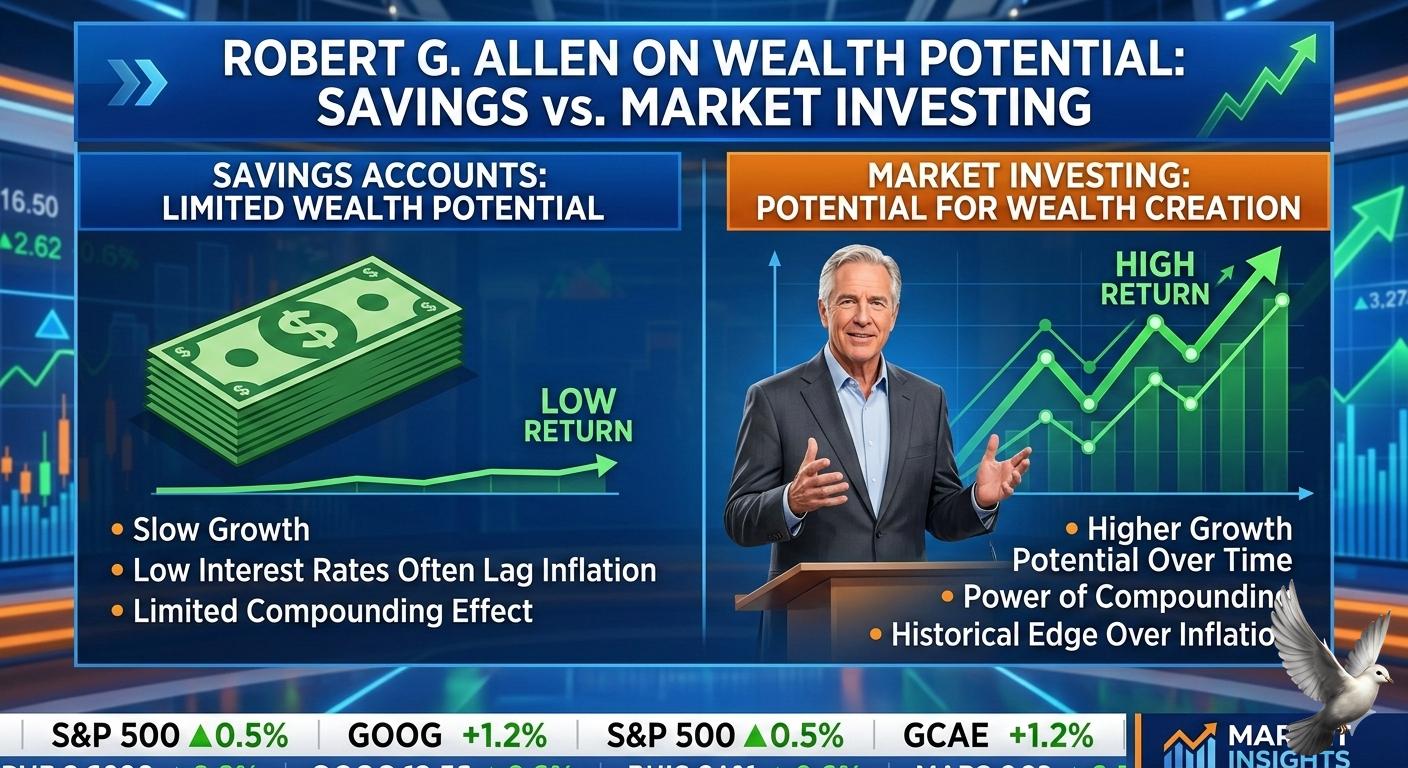
Robert G. Allen on the Limited Wealth Potential of Savings Accounts Compared to Market Investing
Building wealth in 2026 requires a decisive shift from passive saving to strategic investing. While traditional savings accounts offer a sense of security, they currently struggle to protect purchasing power. As of late February 2026, global core inflation remains stubborn at approximately 2.8%, with U.S. figures projected to hover around 3.2%. In this environment, cash held in standard accounts often yields a negative real return, effectively eroding wealth over time. Successful wealth creation now centers on assets that historically outpace these inflationary pressures. The S&P 500 continues to serve as a primary engine for growth, with Wall Street analysts forecasting a total return of nearly 12% for the full year 2026. This significantly exceeds the 30-year historical average of 8.1%, driven by strong corporate earnings which saw a 13.6% year-over-year increase in early 2026. Real estate remains a critical pillar for financial independence. The global market is showing renewed strength as interest rates stabilize. In early 2026, the Bank Rate in major economies like the UK sits at 3.75%, with expectations for gradual easing. Global investment volumes in real estate have rebounded by 19% compared to previous cycles, as investors seek the stability of tangible assets and rental growth, which averaged 6.4% in high-demand sectors recently. Modern portfolio construction has evolved beyond simple diversification. High-net-worth strategies now frequently incorporate private markets to reduce reliance on public volatility. Approximately 83% of advisors now consider private credit and private equity essential for a resilient portfolio. These alternative assets offer a cushion against the "shock weeks" seen in public markets, where indices can occasionally drop 5% or more due to geopolitical or trade-related events. The path to financial independence involves embracing calculated risk. Wealth is no longer just preserved; it is engineered through active participation in the global economy. By moving capital from low-yield savings into growth-oriented investments like large-cap equities and commercial real estate, individuals can ensure their fortunes grow faster than the cost of living. Diversification remains the most effective tool for managing uncertainty. As regional inflation gaps widen between the U.S. and Europe, a global approach to asset allocation helps capture growth while mitigating localized risks. Strategic investors are currently rotating into sectors like energy and industrials, which have shown double-digit leadership in the opening months of the year. Ultimately, saving preserves what you have, but investing creates what you need for the future. In a market characterized by rapid technological shifts and evolving fiscal policies, the disciplined deployment of capital into productive assets is the only proven method for long-term wealth accumulation. [Investment vs. Savings: Which is Better?](https://www.youtube.com/watch?v=0_jF7q5N1D8) This video provides a foundational comparison between saving and investing, illustrating how different asset classes contribute to long-term wealth growth as discussed in the brief.
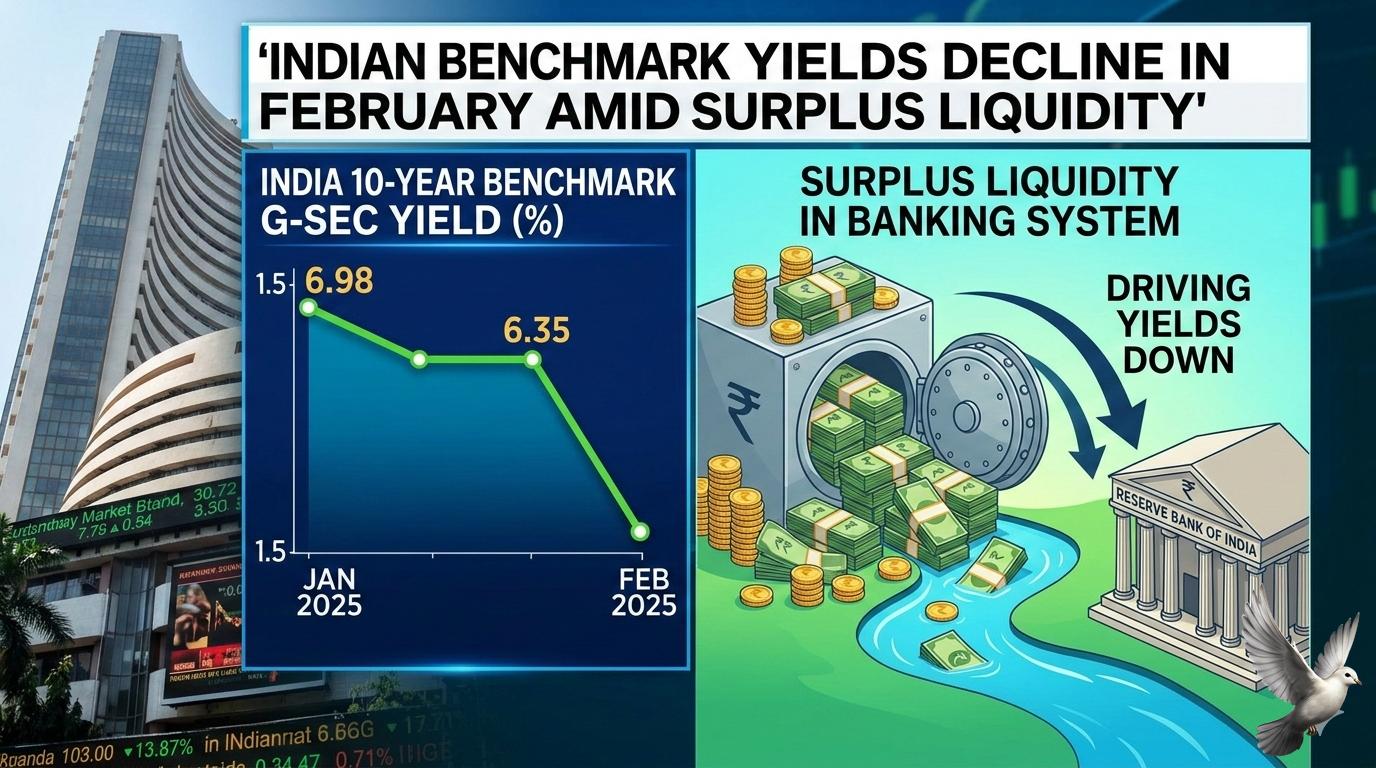
Indian Benchmark Yields Decline in February Amid Surplus Liquidity
The Indian government bond market is navigating a complex period of shifting yields and liquidity adjustments as of late February 2026. While benchmark rates have shown signs of softening, the broader market is reacting to heavy supply pressures and a cautious central bank stance. The 10-year benchmark bond yield is currently hovering around the 6.68% to 6.70% range. This follows a volatile month where yields initially spiked to 6.73% after the Reserve Bank of India (RBI) maintained a neutral policy stance. Recent auctions have seen stronger demand, particularly for state government debt, helping to pull the benchmark down from its monthly highs. Banking system liquidity has emerged as a critical support pillar. The RBI has been exceptionally active, purchasing approximately 47% of the government's total bond issuances so far in the current fiscal year. These Open Market Operations (OMOs) have injected over 6.39 trillion rupees into the system, maintaining a surplus of nearly 3 trillion rupees and preventing a sharper rise in borrowing costs. Despite this surplus, the yield curve is steepening. This is driven by a divergence between short-term rates, which are stabilizing due to high liquidity, and long-term yields, which face pressure from upcoming supply. The government has announced a record gross borrowing target of 17.2 trillion rupees for the next fiscal year (FY27), a figure that exceeded many market projections and continues to weigh on investor sentiment. The RBI's Monetary Policy Committee recently held the repo rate steady at 5.25%. While inflation remains within the comfort zone at approximately 4%, the central bank’s decision to maintain a "prolonged pause" has dampened hopes for immediate rate cuts. This has shifted investor focus toward short-term instruments, while ultra-long bonds—specifically 30-year and 40-year papers—continue to see sustained interest from insurance and pension funds. Credit-to-deposit dynamics remain a structural challenge for the banking sector. With credit growth at 14.6% outpacing deposit growth at 12.5%, many banks are seeing their liquidity coverage ratios shrink. This has forced increased reliance on certificates of deposit (CDs), which have seen their rates climb above 7.30%, reflecting persistent funding competition despite the overall system surplus. Market participants expect the 10-year benchmark to remain within a range of 6.65% to 6.80% in the near term. The primary focus remains on how the market will absorb the final auctions of the current fiscal year and the transition into the heavy borrowing schedule of April.
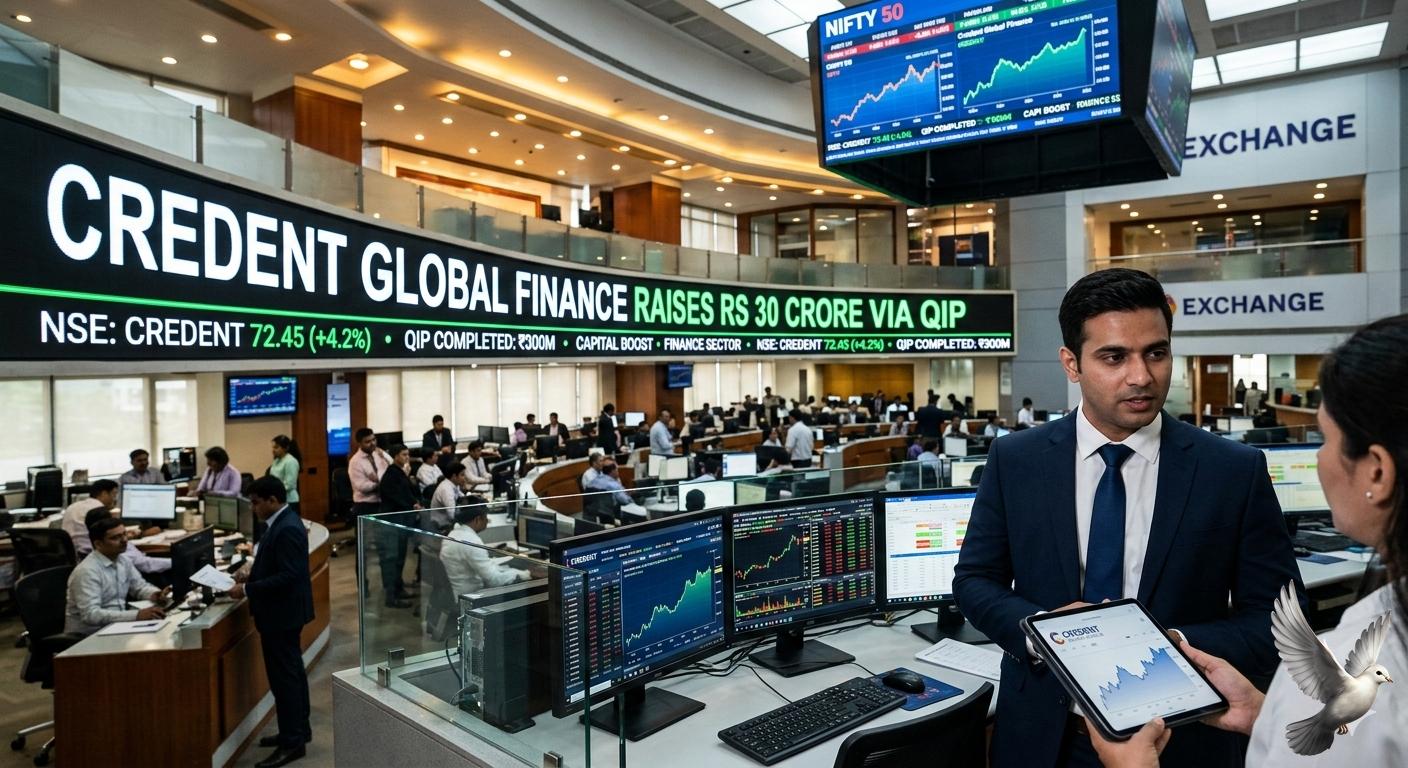
Credent Global Finance Raises Rs 30 Crore via QIP
Credent Global Finance has successfully executed a capital raise of 30 crore through a Qualified Institutional Placement (QIP) to accelerate its strategic expansion. The company allocated 1.00 crore equity shares to institutional investors at an issue price of 30 per share. This move has increased the total paid-up equity share capital to 12.29 crore, providing the necessary liquidity to fund microfinance opportunities and enhance market presence. The fundraising coincides with an exceptional financial performance for the third quarter of 2026. The company reported a 775% year-on-year surge in revenue, reaching 25.74 crore. Net profit for the same period skyrocketed by 3,773%, touching 18.02 crore compared to the previous year. This growth reflects the company’s aggressive disciplined execution and its focus on high-potential credit segments. Market data as of late February 2026 shows the stock trading near 31.90, maintaining a steady uptrend. The company currently holds a market capitalization of approximately 194 crore. Shares have fluctuated within a 52-week range of 20.70 to 35.06, supported by strong institutional interest and an improving price-to-earnings ratio of roughly 7.27. To drive this next phase of growth, the leadership team has been significantly strengthened. The board recently appointed Vikas Kataria as Executive Director and Samir Agarwal as CEO. These strategic additions are intended to enhance corporate governance and operational oversight as the firm scales its lending and advisory operations across new regions, including a recent branch expansion into Delhi. The company remains positioned as a non-banking financial company with a diversified portfolio spanning money lending, asset management, and investment banking. With a strengthened balance sheet and fresh capital, the firm is now focusing on counter-cyclical investing and selective credit opportunities in Eastern India's microfinance sector to deliver long-term stakeholder value. [Credent Global Finance QIP and Earnings Review](https://www.youtube.com/watch?v=FjC3L469h_I) This video provides a detailed breakdown of the recent QIP results and quarterly financial highlights mentioned in the report.

Steel HRC Prices Reach Two-Year High of ₹54,000 per Tonne Amid Ongoing Market Rally
India’s steel market has staged a dramatic recovery, with hot-rolled coil (HRC) prices climbing to a two-year high of ₹54,000 per tonne. This marks a sharp reversal from November lows of ₹47,000, driven by a combination of policy protection, surging input costs, and a frontloaded infrastructure cycle. The government’s decision to impose a 12% safeguard duty on imported HRC has effectively insulated the domestic market. This duty, set to taper slightly to 11.5% in April 2026, has already caused a 13% year-on-year drop in total steel imports. With imported steel currently landing at approximately ₹57,000 per tonne, domestic producers hold a clear pricing advantage. Coking coal remains the primary cost driver, with prices rising 30% year-on-year. Since coking coal accounts for roughly 35% of production costs, Indian steelmakers have successfully passed these expenses downstream. Market analysts have recently raised the 2026 coking coal price forecast to $190 per tonne, suggesting that cost-led price floors will remain elevated throughout the year. Demand fundamentals are robust, with a projected growth of 8% to 9% for the current fiscal year. This surge is fueled by the pre-monsoon construction window and large-scale government projects under the Bharatmala and PM-AWAS schemes. Infrastructure and construction now absorb nearly 65% of India’s total steel output. Steel producers are seeing a significant inflection in financial performance. EBITDA per tonne is now ranging between ₹5,000 and ₹13,600 across major manufacturers. Experts anticipate a further margin expansion of ₹3,000 to ₹4,000 per tonne in the coming quarter as higher realizations take effect and raw material volatility begins to stabilize. The long-term outlook remains aggressive as India targets a production capacity of 300 million tonnes by 2030. While global markets face stagnation, India stands out as the fastest-growing steel consumer. Sustained domestic demand and a disciplined pricing environment are expected to maintain this favorable momentum through the first half of 2026.