Bullish News
Collection
Accord Transformer IPO: Subscription Status and Latest GMP Details
Accord Transformer and Switchgear Limited has seen an exceptional response to its initial public offering on the BSE SME platform. As of the second day of bidding, the ₹25.59 crore issue has already attracted significant capital, with overall subscription exceeding 10 times. Retail investors are leading the charge with a subscription rate of over 16 times, while the Non-Institutional Investor (NII) segment has seen bidding at more than 11 times. This high demand is reflected in the grey market, where shares are commanding a premium of approximately ₹13 per share. This suggests a potential listing price near ₹59, a 28% jump over the upper price band of ₹46. **Key IPO Details** The price band for the issue is set between ₹43 and ₹46 per share. With a minimum lot size of 3,000 shares, the entry-level investment for retail participants stands at ₹138,000. For those applying for the maximum retail allocation of two lots, the total investment is ₹276,000. The bidding process concludes on February 25, 2026. The company expects to finalize share allotments by February 26, with the official listing scheduled for March 2, 2026. **Financial Performance and Growth** The company has demonstrated rapid financial scaling over the last three fiscal years. Revenue from operations surged from ₹40.78 crore in FY23 to ₹79.02 crore in FY25. Even more striking is the bottom-line growth, with Profit After Tax (PAT) climbing from ₹0.88 crore to ₹6.05 crore in the same period. Efficiency metrics remain strong, featuring a Return on Equity (ROE) of 28.1% and a healthy debt-to-equity ratio of 0.55. As of early 2026, the company maintains an executable order book of ₹164.26 crore, providing high revenue visibility for the upcoming quarters. **Market Context and Strategy** The timing of the IPO aligns with a massive expansion in the Indian power equipment sector. The national switchgear market is projected to reach a value of $3.5 billion by 2025, driven by a 9% annual growth rate. This is fueled by the government’s target of 500 GW of renewable energy capacity by 2030 and the rapid rollout of EV charging infrastructure. Accord is positioning itself to capture this growth by utilizing 50% of the IPO proceeds for capital expenditure, specifically for new machinery and equipment. Another 39% is earmarked for working capital to support its increasing order volume. The company operates two specialized manufacturing units in Rajasthan, producing a range of distribution and power transformers up to 20 MVA. Its strategic collaborations with global players like Schneider Electric further strengthen its technical capabilities in the competitive LV/MV control panel segment.

Fractal Industries IPO: Grey Market Premium and Listing Today
Fractal Industries is set to make its professional debut on the BSE SME platform following a successful public offering that concluded on February 18, 2026. The 49.00 crore INR IPO, composed entirely of a fresh issue of 2,268,600 equity shares, was priced at the upper band of 216 INR per share. Market data indicates a total subscription of 5.44 times, reflecting steady interest across investor classes. The Qualified Institutional Buyers (QIB) segment led with 5.95 times coverage, followed by Non-Institutional Investors (NII) at 7.91 times and Retail Individual Investors at 4.09 times. The company is expected to list on February 23, 2026. Current grey market indicators suggest modest listing gains of approximately 3%, pointing toward an opening price in the range of 222 INR to 223 INR. This sentiment aligns with a broader trend of cautious but positive movement within the SME sector this month. Fractal Industries operates a high-capacity garment manufacturing and supply chain business. Its Mumbai facility produces over 300,000 units monthly, supported by a strategic warehouse network across Gujarat, Maharashtra, Haryana, West Bengal, and Karnataka. The firm serves major e-commerce players including Myntra, Ajio, and Flipkart through three primary models: bulk sales, private label manufacturing (PPMP), and direct sales under its own brand, 7ate9, launched in May 2025. Financial performance has shown significant scaling. For the fiscal year ending March 31, 2025, the company reported a total income of 85.51 crore INR, a sharp rise from 50.01 crore INR in the previous year. Profit after tax (PAT) jumped significantly to 7.54 crore INR in FY25, compared to 2.27 crore INR in FY24. EBITDA for the same period stood at 11.15 crore INR with a margin of 13.04%. The momentum has continued into the current fiscal year. For the half-year ended September 30, 2025, Fractal reported a total income of 47.33 crore INR and a PAT of 6.78 crore INR, already nearing its previous full-year profit. The IPO proceeds are earmarked for essential growth drivers, with approximately 36.50 crore INR allocated to meet increasing working capital requirements. The company’s growth strategy focuses on its technologically integrated warehouse management system and expertise in apparel reverse logistics. While the business faces risks such as high client concentration—with the top five customers historically contributing a vast majority of revenue—its expansion into own-brand manufacturing and the high-growth e-commerce sector remains a primary draw for investors.

11 Stocks Cross 200-Day Moving Average
Market Brief: Technical Outlook and Moving Average Trends The broader market maintains a structurally positive outlook as major indices continue to trade above the **200-day Simple Moving Average (SMA)**. This long-term technical indicator remains the primary benchmark for distinguishing between a sustained bull market and a potential regime shift. As of late February 2026, approximately **67.2%** of S&P 500 constituents are holding above this level, confirming that despite recent bouts of volatility, the underlying uptrend for the majority of stocks remains intact. In the United States, the S&P 500 is currently positioned at **6,909.51**, staying comfortably above its 200-day average of **6,529.65**. While the index saw a minor retreat from its January peak of **6,977.26**, it recently reclaimed its **50-day SMA** of **6,896.08**. This crossover suggests that short-term selling pressure is stabilizing, allowing the longer-term upward momentum to reassert itself. Global markets are mirroring this technical resilience with varying degrees of strength. The Indian **Nifty 50** has recently rebounded to the **25,713** level, though it faces immediate resistance near its own moving average hurdles. Meanwhile, the **Hang Seng Index** in Hong Kong has shown signs of a minor bullish breakout, recently clearing its 20-day average to settle near **26,567**. Sector leadership is currently undergoing a notable rotation. While high-growth technology and AI-related names are testing key support levels, traditional sectors are providing the necessary ballast to keep indices above their long-term averages. Energy has emerged as a massive leader with gains of over **14%** recently, while Materials and Industrials have also posted solid single-digit returns. Market participants are closely watching the "Magnificent Seven" and other hyperscaler stocks. These heavyweights are currently trading near critical junctures. Analysts note that as long as these leaders do not decisively break below their 200-day averages, the risk of a systemic trend reversal remains low. Volatility, as measured by the **India VIX** and the **CBOE VIX**, has cooled to levels around **11.94** to **13.86**. This drop in the "fear gauge" typically supports a "buy on dips" environment, provided the price action remains above the long-term **200-day SMA** floor. Historical data suggests that maintaining this level often attracts institutional "dip-buying" from large-scale funds seeking to align with the primary trend.

Indian Stock Market Live: Asian Cues and GIFT Nifty Signal Lower Start
Global Market Brief: February 24, 2026 Global equity markets are showing continued resilience as February draws to a close. Investors have largely pivoted from initial geopolitical jitters toward a focus on fundamental economic expansion. The macro environment remains supportive, characterized by broadening participation across sectors and geographies. In the United States, major benchmarks finished the recent trading week in positive territory. The **Dow Jones Industrial Average** closed at **49,625.97**, a gain of **0.5%**. The **S&P 500** continues to hover near the psychological **7,000** threshold, currently sitting at **6,836.17**, while the tech-heavy **Nasdaq Composite** ended at **22,546.67**. Inflation and Monetary Policy US inflation data for January 2026 came in lower than anticipated, providing a clear tailwind for risk assets. The annual **Consumer Price Index (CPI)** slowed to **2.4%**, the lowest level since early 2021. Core inflation, which excludes volatile food and energy costs, also eased to **2.5%**. The Federal Reserve is currently maintaining interest rates steady, but market consensus has priced in three rate cuts for 2026. Projections suggest a terminal rate settling between **3.0% and 3.25%** by year-end. This shift reflects a normalizing price environment despite persistent labor market tightness and wage growth holding near **3.9%**. Energy and Commodities The energy sector is undergoing significant price recalibration. **Brent Crude** averaged **$67 per barrel** in January but is forecasted to decline toward **$58** as global production begins to outpace demand. Domestic natural gas remains volatile; the **Henry Hub** spot price spiked to **$7.72 per MMBtu** earlier this month due to winter weather disruptions but is expected to average **$4.31** for the remainder of the year. Gold and silver have seen substantial momentum. Silver futures recently surged **10%** to reach **₹2,60,000 per kg** in some markets, while gold futures climbed to **₹1,52,000 per 10 grams**. This movement highlights a sustained appetite for traditional hedges amid ongoing trade policy uncertainty. Technology and Emerging Assets Artificial Intelligence has transitioned from an experimental phase to the structural backbone of the enterprise. The "AI trade" is broadening beyond megacap names into industrials and materials. In the private sector, investment is shifting toward multi-agent platforms and specialized hardware accelerators as organizations seek measurable impact over hype. The cryptocurrency market is currently navigating a period of stabilization following high volatility in late 2025. **Bitcoin** is trading near **$65,834**, with a market capitalization of approximately **$1.3 trillion**. While prices remain below their previous records, the sector is showing less sensitivity to trade-related headlines compared to earlier cycles. International Performance Emerging markets are delivering a diverse mix of growth stories. In India, the **BSE Sensex** recently hit **83,739**, while the **Nifty 50** reached **25,727**. Growth in this region is projected at **7.3%** for the 2025-26 fiscal year. In Asia, the **Nikkei** rose **5.8%** to start the year, supported by ongoing governance reforms in Japan. Global trade remains under pressure from rising tariffs and the reconfiguration of supply chains. Global growth is projected at a subdued **2.6%** for 2026, as major economies like China experience a slight deceleration toward **4.6%**. The reconfiguration of value chains toward risk management over cost-efficiency continues to reshape investment flows.

US Dollar Steady as Asian Markets Weigh New Tariff Developments
The US dollar faced a volatile trading session as the market absorbed a landmark Supreme Court ruling and subsequent executive actions. The Dollar Index (**DXY**) drifted toward **97.74** after a brief rally, as investors weighed the legality of trade protectionism against new administrative measures. While the Supreme Court struck down earlier global tariffs, the White House responded immediately by invoking new authorities to impose a blanket **15%** import duty. This "tariff churn" has created a floor for the greenback, yet prevented a decisive breakout as the legal landscape shifts. Asian markets showed resilience despite the trade friction. Japan’s **Nikkei 225** climbed **0.3%** to reach **57,197**, recovering from earlier selloffs. The Japanese yen remains a point of intense focus, trading near **154.83** against the dollar. Speculation regarding official intervention persists, keeping the **USD/JPY** pair in a tight, cautious range. In Europe, the policy response was swift. The European Parliament has formally postponed a critical vote on a new trade deal with the United States. Officials in Brussels cited the need for "clarity" following the new **15%** duty announcement. This delay adds further pressure to the **EUR/USD**, which is currently hovering near **1.1788**. Commodities and safe-haven assets reflect this heightened defensive posture. Gold remains elevated at **$5,222.85**, signaling that institutional players are hedging against a potential "perpetual tariff" environment. Global trade volumes face immediate headwinds as the **150-day** temporary tariff window begins.

Gaudium IVF IPO: Market Analysis and Subscription Considerations
**Nvidia Market Brief: February 2026** Nvidia continues to anchor the global semiconductor landscape as it enters a pivotal earnings week. The company currently commands a market capitalization of **$4.71 trillion**, maintaining its status as a primary driver of the S&P 500 and the broader AI infrastructure trade. As of February 24, 2026, the stock is trading near **$189.20**, following a period of consolidation. Market sentiment remains focused on the imminent Q4 fiscal year 2026 results scheduled for release on February 25. Analysts have set a high bar, with revenue expectations reaching **$65.68 billion**, representing a significant jump from the **$57 billion** reported in the previous quarter. **The Blackwell-Rubin Transition** The central narrative for early 2026 is the rapid succession of chip architectures. The Blackwell platform, which began shipping in late 2025, is currently sold out through mid-2026. Despite this supply constraint, Nvidia has already pivoted to the future. At CES in January 2026, the company officially launched the **Rubin platform**. This new architecture utilizes HBM4 memory and is engineered for "Agentic AI" and advanced reasoning. Key performance claims include: * **10x reduction** in inference token costs compared to Blackwell. * **5x increase** in inference performance. * **4x reduction** in the number of GPUs required to train complex Mixture-of-Experts (MoE) models. This aggressive annual release cycle has intensified pressure on enterprise buyers, who must now decide between deploying Blackwell units immediately or waiting for the superior economics of Rubin, expected to hit scale in the second half of 2026. **Sector Trends and Indicators** The global semiconductor market is approaching a historic milestone, with total industry sales projected to hit **$1 trillion** during 2026. This growth is increasingly top-heavy; while high-value AI chips now account for nearly **50% of industry revenue**, they represent less than **0.2% of total unit volume**. Nvidia’s Data Center segment remains the industry’s powerhouse, with projected quarterly revenue of **$59.9 billion**. In contrast, secondary segments like Gaming and Automotive are showing more moderate trajectories. Gaming revenue is expected to land near **$4.1 billion**, while the Automotive sector continues to grow steadily through the integration of the DRIVE AV platform. **Economic Footprint** Nvidia’s influence extends beyond its own balance sheet. The company now holds a weighting of over **7%** in the S&P 500. Its capital expenditure signals from "Hyperscalers"—including Microsoft, Alphabet, and Meta—are viewed as the definitive pulse check for the global AI build-out. Profitability remains robust, with non-GAAP gross margins expected to hold at approximately **74.97%**. While geopolitical export controls and supply chain bottlenecks at specialized foundries remain persistent risks, the transition to the Rubin architecture is expected to sustain Nvidia’s pricing power through the remainder of the year.
PNGS Reva Diamond Jewellery IPO: Growth Drivers and Risk Factors from the RHP
Market performance across major asset classes is currently defined by a sharp pivot toward defensive strategies. Volatility has surged as investors digest a combination of aggressive trade policies, shifting interest rates, and the disruptive impact of emerging technologies on corporate earnings. Equities and Indices The U.S. stock market experienced a significant retreat in the latest session. All three major indices fell by more than **1%** as risk appetite dampened. The Dow Jones Industrial Average dropped **821.91 points** to close at **48,863.62**, a decline of **1.66%**. The S&P 500 slid **1.04%** to **6,850.42**, while the Nasdaq Composite fell **1.13%** to **22,627.27**. Technology and payment firms faced the heaviest selling pressure. Notable losses included IBM, which plummeted **13.1%**, and American Express, which sank **7.2%**. Conversely, defensive consumer staples like Walmart gained **2.3%**, reflecting a rotation toward "real economy" stocks. Energy and Commodities Brent crude oil futures are hovering near a six-month high at approximately **$71.40 per barrel**. Prices remain supported by geopolitical tensions in the Middle East and supply disruptions in North America due to winter weather. However, the long-term outlook remains bearish, with forecasts suggesting an average price of **$58 per barrel** for 2026 as global production is expected to outpace demand. Gold has staged a powerful recovery after mid-month volatility. In Indian markets, 24K gold surged to **₹16,135 per gram** on February 23. Globally, gold continues to serve as a primary hedge against inflation and policy uncertainty. In contrast, industrial metals like copper have softened. Copper fell **0.95%** to roughly **$12,700 per ton**, weighed down by rising inventories and a seasonal lull in Chinese demand. Economic Indicators and Inflation Global core inflation is projected to stabilize at **2.8%** throughout 2026. However, regional disparities are widening. U.S. inflation is expected to accelerate above **3.2%** due to tariff pass-through effects, while the Euro area may see a moderation toward **1.9%**. The U.S. Federal Funds rate currently sits at **3.75%**. While some analysts expect the Federal Reserve to remain on hold, others project a potential reduction of **50 basis points** later in the year if labor market momentum softens further. Global GDP growth for 2026 is forecast at a steady but modest **2.7% to 2.8%**. Trade and Manufacturing International trade is facing headwinds from a new **15%** global tariff policy implemented by the U.S. administration. This has prompted a pause in major trade agreements, including those with the European Parliament. While global trade expanded by **3.8%** in 2025, momentum is expected to slow to **2.2%** this year as policy uncertainty impacts shipment volumes.

**Global Markets Trend Lower Amid Tariff Uncertainty and US Lead**
Asia Market Alert: AI Anxiety and Tariff Shifts Asian equity markets are facing downward pressure as of February 24, 2026. This retreat follows a turbulent session on Wall Street where renewed fears regarding artificial intelligence disruption and shifting US trade policies dampened investor appetite. The AI "Scare Trade" A significant sell-off in the technology sector has been triggered by fresh concerns over how AI will impact corporate bottom lines. While 2026 began with high expectations for AI-driven growth, the narrative is shifting toward the risks of industry displacement. * **IBM** shares plummeted **13%** in their worst single-day performance since 2000 after new AI tools demonstrated the ability to modernize legacy programming languages. * The **S&P 500** slid **1%**, while software-focused ETFs dropped nearly **4.8%**. * Investors are increasingly skeptical of "momentum-driven" tech sectors, questioning when massive AI investments will yield tangible returns. Tariff Turmoil and Regional Impact Uncertainty regarding US trade policy remains a primary headwind. Following a Supreme Court ruling that limited previous trade authorities, the White House announced a new, across-the-board **15%** tariff on imports. * **Japan’s Nikkei 225** and **South Korea’s KOSPI** both edged lower as they reopened following recent holidays. * **Hong Kong’s Hang Seng** futures fell **0.7%**, reflecting caution as mainland Chinese markets prepare to return from the Lunar New Year break. * In contrast, **Australia’s S&P/ASX 200** managed a slight **0.3%** gain, largely because its index is less exposed to the volatile technology and software sectors. Market Indicators and Safe Havens The shift in sentiment has prompted a rotation into traditional defensive assets. Gold and government bonds are seeing increased inflows as traders pare back risk. * **Gold** surged more than **2%**, trading near **$5,230** per ounce. * **Bitcoin** tumbled below the **$65,000** mark, caught in a broader retreat from speculative assets. * The **US 10-year Treasury yield** fell to **4.03%**, as investors sought the safety of sovereign debt. Divergent Performance Despite the current dip, Asian markets have shown notable resilience earlier in the year compared to US peers. The **KOSPI** has gained over **40%** year-to-date, far outperforming the **Nasdaq Composite**, which has struggled with a **1.5%** decline in the same period. While the long-term outlook for Asian semiconductors remains constructive due to reasonable valuations—trading at a forward P/E of **16.3x** versus **25x** for the Nasdaq—the immediate term is defined by high volatility. Traders are now closely watching upcoming US inflation data and corporate earnings for signs that the AI-driven rally can be sustained.
US Equities Decline on AI Industry Concerns and Trade Policy Uncertainty
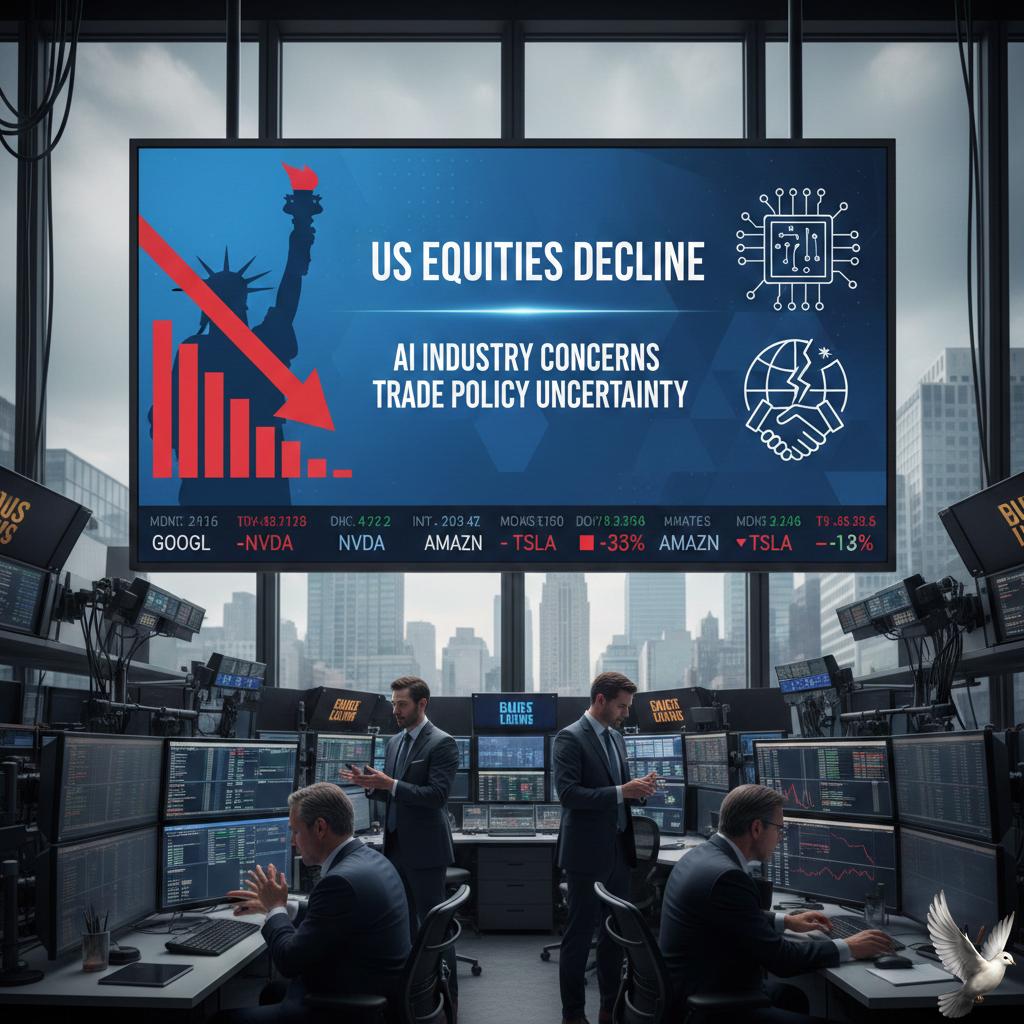
A broad market selloff intensified as the first year of President Trump’s second term continues to grapple with policy shifts. All three major U.S. stock indexes fell more than 1% by the closing bell on February 23, 2026. The Dow Jones Industrial Average led the retreat, dropping 761.58 points or 1.53% to finish at 48,864.39. The S&P 500 slipped 1.14% to 6,830.45, while the Nasdaq Composite shed 1.13% to close at 17,914.54. Risk appetite has been severely dampened by a combination of technological disruption and erratic trade signals. Artificial intelligence remains a primary source of volatility. New advancements are sparking fears of industry-wide displacement, particularly in the software and financial services sectors. IBM shares plunged 13.1% after the release of sophisticated new coding tools by Anthropic, while American Express sank 7.2% following research highlighting risks to the traditional consumer credit labor force. Trade policy has added further layers of uncertainty. Following a Supreme Court ruling that struck down previous global tariffs, the administration moved to impose a new 150-day temporary tariff framework under Section 122. This measure includes a 10% to 15% import duty, which has triggered friction with European and Chinese trade partners. Economic indicators show a complex backdrop for these moves. While corporate earnings for the S&P 500 grew by 13.2% in the final quarter of 2025, job growth has slowed significantly. The U.S. economy added only 181,000 jobs throughout 2025, the lowest non-recessionary level since 2003. Investors are now pivoting toward safety. U.S. Treasury yields have retreated from their mid-2025 peaks, with the 10-year yield settling near 4.1%. Gold has emerged as a major beneficiary of the instability, climbing above $4,300 per ounce as markets price in persistent geopolitical and financial risks. Market focus now shifts to high-stakes earnings reports from major tech and retail players later this week. Traders are watching for signs of whether AI can deliver immediate revenue growth to offset the rising costs and structural disruptions currently fueling the selloff.

Pre-Market Analysis and Trading Outlook for the Current Session
Indian equity markets demonstrated resilience as the **Nifty 50** successfully reclaimed the psychological **25,700** level, closing at **25,713** on Monday. This gain of **142 points** (up **0.55%**) marks a solid second consecutive session of growth, fueled by a late-session recovery and selective buying in domestic heavyweights. The **BSE Sensex** mirrored this strength, jumping **480 points** (up **0.58%**) to settle at **83,294.66**. While large-cap indices showed stability, the broader market provided a varied picture; the **BSE MidCap** index rose by **2%** while the **SmallCap** index surged **2.5%**, signaling a heightened risk appetite among retail participants. Sectoral performance remained bifurcated. **PSU Banks** and **Healthcare** stocks were the primary drivers of the rally, with **Union Bank of India** hitting a 52-week high of **200.20** following a **3.2%** intraday surge. **FMCG** and **Infrastructure** also provided support, with notable gains in **HUL**, **HDFC Bank**, and **Adani Ports**. Conversely, the **IT sector** continued to face headwinds, with the index sliding as global brokerages issued downgrades. Heavyweights like **Infosys**, **TCS**, and **Tech Mahindra** were among the top laggards, reflecting concerns over AI-related disruptions and valuation corrections. Volatility eased as the **India VIX** decreased by **2.65%**, suggesting a more stable environment for investors. The **Indian Rupee** also strengthened, ending at **90.88** against the US Dollar, supported by steady domestic institutional inflows which helped offset ongoing foreign portfolio outflows. Global cues turned cautiously optimistic after news regarding trade tariff regulations in the US, providing a favorable backdrop for the Indian benchmarks. Analysts maintain a "buy-on-dips" outlook, identifying **25,500** as a critical support zone for the Nifty, while **26,000** remains the immediate resistance level to watch for a sustained breakout. Institutional activity continues to play a stabilizing role. While foreign investors sold approximately **935 crore** in recent sessions, domestic institutional investors absorbed the pressure with net purchases exceeding **2,637 crore**, highlighting the structural strength of domestic liquidity in the current market cycle.

RBI Monitors IDFC First Bank Fraud; No Systemic Risk Identified, Says Sanjay Malhotra
The Reserve Bank of India (RBI) is maintaining a vigilant watch over a **₹590 crore** fraud reported by IDFC First Bank at its Chandigarh branch. The incident, disclosed on February 22, 2026, involved discrepancies in accounts belonging to certain Haryana government entities. Governor Sanjay Malhotra has clarified that the case is an isolated incident resulting from internal collusion and does not pose a systemic risk to the Indian banking sector. The bank has already suspended **4 officials** and engaged KPMG for a forensic audit to determine the full extent of the impact, which could reach up to **₹1,000 crore** according to preliminary probe details. Despite this disruption, the RBI maintains that the broader financial system remains resilient. The banking regulator continues to focus on macroeconomic stability, recently holding the repo rate steady at **5.25%** during the February 2026 policy meeting. The central bank has updated its retail inflation projections for the 2025–26 financial year. Headline CPI inflation is now projected at **2.1%** for the full year, though it is expected to firm up to **3.2%** in the current January–March quarter (Q4). Looking ahead, the RBI anticipates inflation to normalize toward **4%** and **4.2%** in the first two quarters of the next fiscal year. Liquidity management remains a high priority as the RBI transitions to stricter funding rules. Starting April 1, 2026, new norms will require banks to provide credit to capital market intermediaries only on a **100%** collateralized basis. This shift is designed to reduce leverage and protect the system from volatility. The RBI is actively using variable rate repos and open market operations to ensure smooth credit flow. While these measures may lead to a temporary tightening of short-term liquidity, the regulator views them as essential for long-term financial discipline. Market analysts note that while the IDFC First Bank incident caused a sharp **15–20%** intraday drop in its share price, the bank’s capital adequacy remains strong. The potential financial hit is estimated at approximately **1%** of the bank's net worth, ensuring that the lender's operational capacity remains intact.

Gold and Silver Prices Record Three-Week High
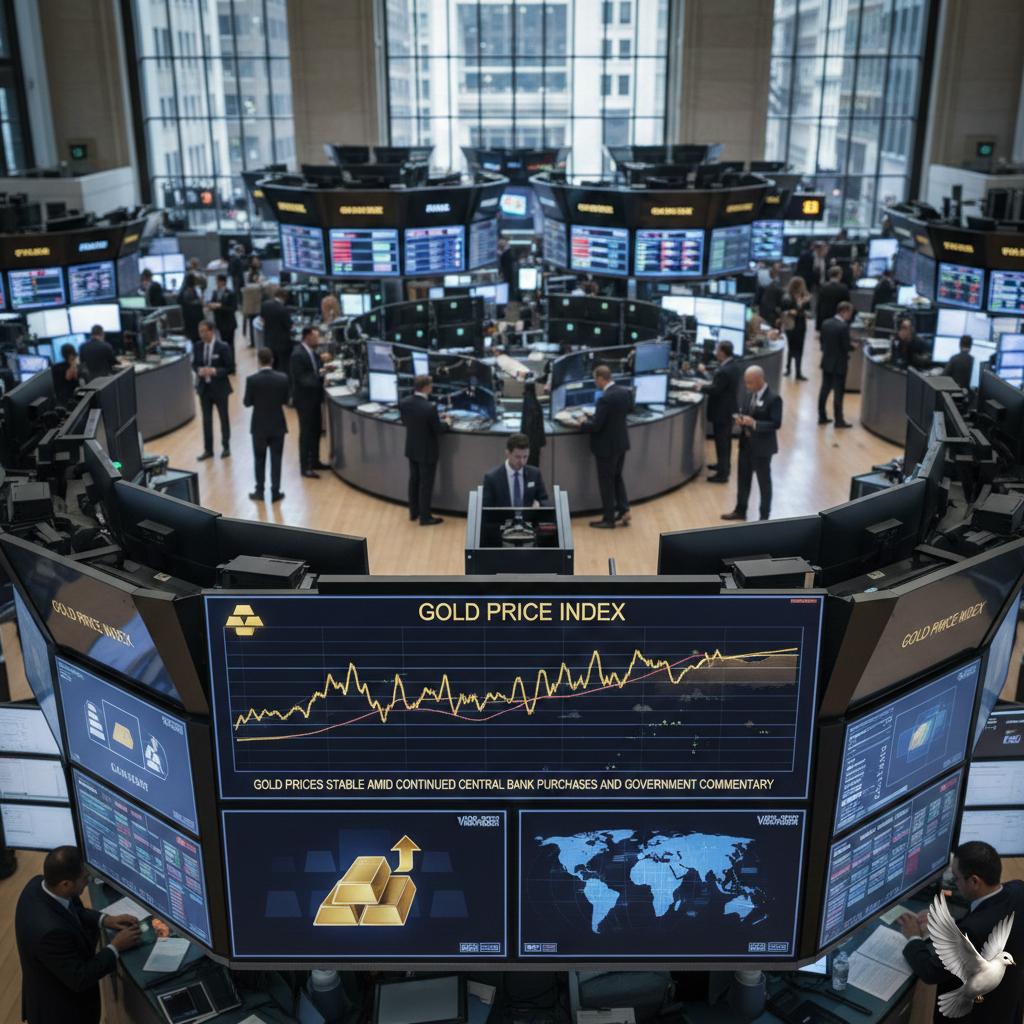
Precious metals experienced a significant rally on Monday, February 23, 2026, driven by a dramatic shift in U.S. trade policy and a weakening dollar. Silver led the charge with a massive gain of ₹25,000 per kg in domestic markets, while gold prices surged by ₹3,362 per 10 gm. The primary catalyst was a U.S. Supreme Court ruling that struck down President Trump’s sweeping "emergency" tariffs. In response, the President immediately announced a new global tariff of 15% under a different legal statute. This "tariff chaos" has triggered intense market volatility and raised concerns about a widening U.S. budget deficit, which is projected to grow by an additional $2 trillion. International gold prices hit a three-week high, surging as much as 1.3% during early trading to reach $5,176 per ounce. In some markets, spot gold even touched $5,229 per ounce. This represents a recovery of over $100 from recent lows, fueled by investors seeking safety as global trade tensions escalate. Silver followed gold’s momentum with an explosive 9% single-day rally. Domestic silver prices in India reclaimed the ₹3,00,000 per kg mark. Globally, silver rose nearly 4% to hit a two-week high of approximately $88 per ounce, balancing its role as both a safe-haven asset and a critical industrial metal for the AI and solar sectors. The U.S. dollar index weakened to 97.8 following the court decision, providing further tailwinds for bullion. Additionally, poor U.S. economic data—including a sharp slowdown in GDP growth to 1.4%—has increased expectations that the Federal Reserve may be forced to cut interest rates more aggressively to stabilize the economy. Geopolitical risks are adding to the upward pressure. Markets are closely monitoring military build-ups in the Middle East and the upcoming nuclear negotiations in Geneva. Analysts note that the combination of trade protectionism, slowing economic growth, and regional instability is creating a strong bullish environment for precious metals. Institutional demand remains robust, with central banks expected to purchase over 755 tonnes of gold in 2026. Experts suggest that if the current trade uncertainty persists, gold could maintain its trajectory toward a baseline target of $5,400 per ounce, while silver remains positioned for high volatility as markets react to the immediate implementation of the new 15% global surcharge.

Indian Markets Rise on Gains in Banking and Auto Sectors Ahead of Derivatives Expiry
Market Update: Indian Equities Extend Gains Indian benchmark indices climbed for a second consecutive session on Monday, February 23, 2026. The **BSE Sensex** rose **480 points** to close at **83,295**, representing a **0.6%** increase. Similarly, the **NSE Nifty 50** gained **141 points** to settle at **25,713**, an uptick of **0.5%**. Investor sentiment was buoyed by a landmark ruling from the US Supreme Court, which struck down several broad-based tariffs previously imposed under the International Emergency Economic Powers Act. This legal shift is expected to ease the effective tariff burden on Indian exports, potentially dropping rates from **25%** toward a more manageable **10% to 15%** range. Sectoral Performance and Global Context The banking and infrastructure sectors led the rally. **PSU Banks** saw a significant jump of over **2%**, while **Adani Ports** emerged as the top individual gainer, rising **2.8%**. Other notable performers included **Kotak Mahindra Bank**, which added **2.2%**, and **UltraTech Cement**, up **1.6%**. Conversely, the **IT sector** faced a sharp decline of **1.1%**. Major firms including **Infosys** and **HCL Tech** fell between **0.7%** and **1.8%** following cautious brokerage reports and renewed concerns regarding the impact of artificial intelligence on traditional service models. Trade Policy and Capital Flows While the legal ruling provided immediate relief, fresh uncertainty emerged as the US administration signaled a new **15%** global baseline tariff to replace invalidated measures. This has led to the rescheduling of interim trade deal negotiations between New Delhi and Washington, originally set for late February. Institutional activity showed a shift in participation. **Foreign Portfolio Investors (FPIs)**, who were heavy net sellers in January, turned into net buyers during early February, contributing to the current market resilience. **Domestic Institutional Investors (DIIs)** continue to provide a floor for the market, balancing global volatility with consistent inflows. Key Indicators * **Sensex:** 83,295 (**+0.6%**) * **Nifty 50:** 25,713 (**+0.5%**) * **BSE MidCap:** 2.0% increase * **BSE SmallCap:** 2.5% increase * **Indian Rupee:** 90.88 per USD * **Brent Crude:** $71.44 per barrel Broader market participation remained healthy, with the advance-decline ratio favoring gainers. Investors are now looking toward upcoming Q4 GDP data and global inflation prints to determine if this upward momentum can be sustained against a backdrop of shifting international trade rules.
Analysts Lower Ratings and Price Targets for Major IT Firms Citing Downside Risks
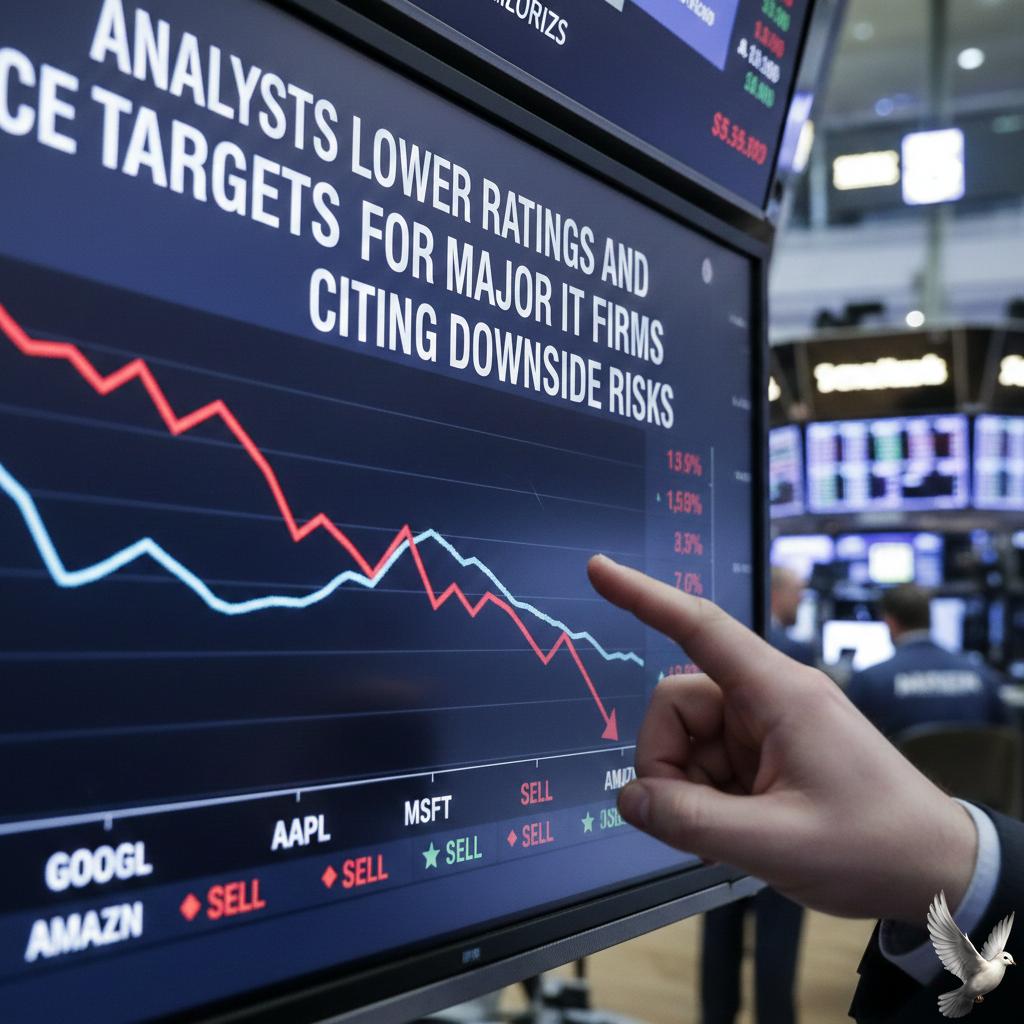
The Indian IT sector is currently navigating a period of significant structural re-evaluation. The Nifty IT index has witnessed a sharp decline, shedding approximately 19.5% month-to-date and over 22% in the last year. As of February 24, 2026, the index is trading near 31,550, reflecting a deep valuation correction amid growing fears of AI-led disruption. Global brokerage Jefferies has issued a cautious outlook, downgrading major industry leaders. Tata Consultancy Services (TCS) and LTIMindtree have been moved to "Underperform," with target prices slashed to 2,350 and 4,300 respectively. Infosys and HCL Technologies have been downgraded to "Hold," with revised targets of 1,290 and 1,390. The primary concern is the potential for AI to cause "revenue deflation" in traditional managed services, which account for 22% to 45% of total revenue for large-cap firms. Analysts warn that in a worst-case scenario, sector valuations could see an additional 30% to 65% derating if growth continues to falter beyond the current fiscal year. In contrast to the large-cap struggle, a clear preference has emerged for mid-sized IT firms. These companies are viewed as more agile and better equipped to pivot toward new AI consulting and implementation opportunities. Top picks in this segment include Coforge, Sagility, and IKS, which are projected to deliver earnings growth of 19% to 25% through 2028. Coforge has recently faced its own technical pressures, with its share price trading around 1,288. However, it remains a favorite for its ability to secure faster growth compared to the 6% earnings growth expected for large-cap peers. Market participants are closely watching the 1,250 support level for Coforge as a critical marker for near-term momentum. Broadly, the Indian tech industry is still on a path to reach a 350 billion dollar valuation by late 2026, contributing nearly 10% to the national GDP. While the long-term outlook remains tied to cloud and data center expansion, the immediate market sentiment is dominated by the need for companies to overhaul their operating models to survive the AI-driven shift. Foreign institutional investors have recently shown mixed activity, though they were net buyers in early February following a major trade deal. However, the IT sector continues to lag behind broader market indices like the Nifty 50, which has remained relatively steady above the 25,500 mark. [Nifty IT Index Overview](https://www.youtube.com/watch?v=3u9-YNdSIU4) This video provides a deep dive into the specific drivers and bottlenecks facing the Indian IT sector in 2026. http://googleusercontent.com/youtube_content/0

AU Small Finance Bank Initiates Internal Investigation Following Account Issues in Haryana
AU Small Finance Bank is currently conducting an extensive internal review following its de-empanelment by the Haryana government on **February 18, 2026**. The state’s finance department issued a circular halting all government transactions with the lender, citing irregularities in fund management. This administrative action was triggered by the detection of **14 suspected transactions** totaling **₹47 crore**. These funds were transferred from a specific government account to a private customer account, both maintained at the bank. The bank has clarified that the government account was officially closed on **January 15, 2026**, with the remaining balance of **₹25 crore** plus interest returned to the originating institution. Preliminary findings by the bank indicate no evidence of financial loss or fraudulent activity affecting its own books. To maintain the integrity of the ongoing probe, certain employees have been relieved of their duties. The bank maintains that all accounts were opened in strict compliance with existing **KYC** and authorization protocols. The financial impact of this de-empanelment is already visible in the bank's deposit profile. Between **February 17** and **February 21, 2026**, deposits from the Haryana government dropped from approximately **₹735 crore** to **₹538 crore**. Despite this decline, the bank notes that these funds represent only **0.4%** of its total deposit base as of **December 31, 2025**. Market sentiment reacted sharply to the news. On **February 23, 2026**, shares of AU Small Finance Bank fell by **5.40%**, closing at **₹974.10** on the NSE. This followed a period of strong performance where the stock had reached a high of **₹1,029.65** just days prior. The bank’s market capitalization currently stands near **₹73,018 crore**. Broadly, the lender remains in a healthy financial position. Its **Q3 FY26** results showed a **26%** year-on-year jump in net profit to **₹668 crore**. Total deposits grew **23.3%** to reach **₹1.38 lakh crore**, while the gross loan portfolio expanded by **19.3%** to **₹1.30 lakh crore**. Asset quality remained stable with a Gross NPA of **2.30%**. The bank is actively engaging with Haryana state authorities to address the concerns and seek re-empanelment. This development comes as the institution prepares for its transition into a universal bank, having recently strengthened its board with three new independent directors to enhance governance.

IDFC Fraud Allegations Raise Concerns Over Low-Cost Account Stability Across Private Banking Sector
Market Brief: Government Deposit Shift & Private Banking Scrutiny The landscape for government deposits in India is shifting following high-profile discrepancies involving state funds at private lenders. The Haryana government has officially de-empanelled IDFC First Bank and AU Small Finance Bank with immediate effect. This directive bars all state departments, boards, and corporations from parking, investing, or transacting funds through these institutions. The move follows the disclosure of a ₹590 crore fraud at IDFC First Bank’s Chandigarh branch. The discrepancy, involving Haryana government-linked accounts, represents roughly 20% of the bank's projected pre-tax profit for the 2026 fiscal year. In a parallel development, AU Small Finance Bank faced scrutiny over ₹47 crore in transactions, leading to a sharp decline in its Haryana government deposits from ₹735 crore to ₹538 crore within a single week in February 2026. Market sentiment reacted sharply to these events. Shares of IDFC First Bank plummeted by 20% in a single session, erasing approximately ₹14,000 crore in market capitalization. AU Small Finance Bank shares also fell by 10% following the de-empanelment news. Investors are closely monitoring the potential for a broader contagion effect as other state governments re-evaluate their exposure to private sector lenders. A significant migration of funds toward state-run institutions like State Bank of India (SBI) and Punjab National Bank (PNB) is now anticipated. The Haryana government has already directed its entities to prioritize nationalized banks for all future banking relationships. This flight to safety could reverse recent trends where private banks were gaining deposit market share, which had reached 34.8% by March 2025. The impact on low-cost deposits is a primary concern for the private banking sector. Government funds typically provide a stable source of Current Account and Savings Account (CASA) deposits. A mass withdrawal could tighten liquidity and increase funding costs for private lenders, who may now need to offer higher interest rates on term deposits to retain their capital base. Operational oversight is also under the spotlight. The fraud at IDFC First Bank was only discovered when the government attempted to close an account, revealing a mismatch between reported and actual balances. Consequently, the Haryana finance department has mandated a full reconciliation of all government bank accounts by March 31, 2026, signaling a period of heightened compliance and tighter auditing across the industry.

PNGS Reva IPO raises Rs 170 crore from anchor investors including Citigroup and Societe Generale
PNGS Reva Diamond IPO Brief **PNGS Reva Diamond Jewellery** has successfully secured **Rs 170.58 crore** from anchor investors ahead of its initial public offering. The company allotted **44,19,200 equity shares** at a fixed price of **Rs 386 per share** to a mix of global and domestic institutions. Key participants in the anchor round included **Citigroup Global Markets Mauritius** and **Société Générale**. From the domestic side, **Tata India Consumer Fund** and **Groww Mutual Fund** provided significant support, highlighting institutional confidence in the brand's diamond-centric retail model. The main public issue, valued at **Rs 380 crore**, opens for subscription on **February 24, 2026**, and will close on **February 26, 2026**. The offer is structured as a book-building route with a price band of **Rs 367 to Rs 386 per share**. Investors must bid for a minimum lot of **32 shares**, requiring an outlay of **Rs 12,352** at the upper cap. Market sentiment remains cautiously optimistic. Unofficial grey market premiums (GMP) as of **February 23, 2026**, indicate a potential listing gain of approximately **5.70%**, with shares trading near **Rs 408**. Strategic Utilization of Funds The IPO is entirely a fresh issue of shares. The company has earmarked **Rs 286.56 crore** of the proceeds to expand its retail footprint by opening **15 new Company Owned Company Operated (COCO) stores** by FY2028. An additional **Rs 35.40 crore** is allocated for marketing to bolster brand awareness in Tier-1 and Tier-2 cities. Financial Health and Sector Context PNGS Reva reported **Rs 258.18 crore** in revenue for FY2025 with a profit after tax of **Rs 59.47 crore**. While the brand maintains a high **PAT margin of 23%**, recent H1FY2026 data shows a rise in inventory to **Rs 313 crore**, reflecting the capital-intensive nature of the diamond trade. The sector is currently buoyed by the **Union Budget 2026**, which maintained stable customs duties on gold and silver. However, retail gold prices remain volatile; as of late February, **24K gold** is trading near **Rs 159,390 per 10 grams** in Mumbai. Despite price fluctuations, the organized jewelry market is projected to reach **$130 billion to $150 billion** in the coming decade, driven by rising disposable incomes and a shift toward branded luxury. Issue Structure * **QIB Reservation:** 75% of the offer * **Retail Reservation:** 10% of the offer * **NII Reservation:** 15% of the offer * **Listing Date:** Tentatively scheduled for **March 4, 2026**, on BSE and NSE.

Domino's Stock Rises as U.S. Sales Exceed Expectations
Domino's Pizza shares surged after the company released fourth-quarter 2025 financial results that surpassed market expectations for U.S. growth. The world’s largest pizza chain reported a 3.7% increase in U.S. same-store sales for the final quarter of the year, outperforming analyst estimates of 3.47%. This performance was driven by a focused "Hungry for MORE" strategy, which emphasized value-driven promotions and a significant expansion of the brand's digital reach. Total revenue for the quarter reached $1.54 billion, a 6.4% increase compared to the previous year, while the company’s global retail sales grew by 4.9%. Strategic investments in the Domino’s Rewards loyalty program proved critical. The program ended 2025 with 37.3 million active users, representing a nearly 20% increase in membership over the year. Management highlighted that the program is effectively capturing "light users" and carryout customers, creating a consistent sales flywheel. Operational efficiency also remained a core focus throughout the year. The company successfully rolled out 1,600 automated dough-stretching machines across the U.S. and reduced average delivery times by two minutes. These improvements supported a 31.2% jump in annual free cash flow, which reached $671.5 million. In response to this strong cash position, the Board of Directors approved a 15% increase in the quarterly dividend to $1.99 per share. The company also demonstrated shareholder commitment by repurchasing $354.7 million in common stock during fiscal 2025. Looking ahead to 2026, Domino's expects to further increase its market share within a growing U.S. pizza category. The chain plans to launch a completely revamped e-commerce site and expand its presence on third-party aggregators like DoorDash. While international same-store sales growth saw a more modest increase of 0.7% in the fourth quarter, the company maintained its long-term expansion goals. Domino's added 776 net new stores globally in 2025, bringing its total footprint to over 22,100 locations across 90 markets. Management remains optimistic about the sector’s resilience. Despite broader economic pressures, the pizza category has maintained a steady growth rate of 1% to 2% annually. Domino's aims to leverage its scale and value advantages to double its retail sales in the coming years.

Key Factors Influencing Stock Market Trends for Tuesday
Indian equity benchmarks Sensex and Nifty 50 maintained positive momentum on Monday, February 23, 2026, as global markets reacted to a landmark legal shift in US trade policy. The domestic rally was primarily fueled by a 6-3 US Supreme Court ruling that struck down sweeping tariffs previously imposed under emergency powers. The BSE Sensex climbed **479.95 points**, or **0.58%**, to settle at **83,294.66**. During intraday trade, the index displayed even greater strength, surging over **670 points** to reach a high of **83,486.15**. The NSE Nifty 50 advanced **141.75 points**, or **0.55%**, closing at **25,713**. Technical analysts identify the **25,800–25,830** zone as the immediate hurdle for the index. A decisive move above this resistance could trigger a rally toward the **26,000** psychological level, while **25,600** remains a crucial support floor. Market volatility, as measured by the India VIX, eased slightly by **1.57%** to settle around the **14.13** mark. This cooling of the "fear gauge" suggests a temporary reduction in trader anxiety, although the broader market breadth remained cautious with approximately **2,400** declining stocks against **1,900** advances on the BSE. Banking and consumer-facing sectors led the gains. The Nifty PSU Bank index rose **1.36%**, supported by a rally in State Bank of India which hit a 52-week high. High-weightage financial stocks like HDFC Bank and Axis Bank also saw significant buying interest. Conversely, the Nifty IT index fell **1.42%** as concerns over AI-driven service disruptions continued to weigh on tech heavyweights like Infosys and Wipro. The global landscape remains complex following the US court verdict. While the ruling invalidated broad tariffs, the US administration immediately responded by invoking Section 122 of the Trade Act to implement a **15%** global tariff. This "Plan B" has created fresh uncertainty, though the initial court-driven relief provided a tailwind for emerging market equities. In other asset classes, gold prices surged by **1.8%** to reach nearly **₹1.59 lakh** per 10 grams on the MCX, driven by a weakening US dollar and safe-haven demand. The Indian rupee showed slight appreciation, trading near **90.90** against the dollar, while the 10-year benchmark bond yield slipped to **6.70%**. Investors are now pivoting their focus toward domestic fundamentals and upcoming renegotiations of trade pacts. While the current trend is bullish, the persistence of the rally depends on the Nifty's ability to clear overhead resistance amid evolving international trade dynamics.
Gold Prices Stable Amid Continued Central Bank Purchases and Government Commentary
Market Brief: Trade Policy Shifts Drive Global Volatility Global financial markets entered a period of heightened sensitivity today, Monday, February 23, 2026. The primary catalyst is a landmark U.S. Supreme Court ruling that struck down several broad global tariffs. In response, the administration has pivoted to alternative mechanisms. This includes a new **10%** global tariff under Section 122 and a flat **15%** import levy. These rapid policy shifts have injected fresh uncertainty into global trade dynamics, prompting a significant flight to safety. Equity and Fixed Income U.S. equity markets opened the week under pressure as investors weighed the impact of the new trade measures. The **Nasdaq 100** is testing key support levels near **24,500**, while the **S&P 500** remains sensitive to the "tariff turbulence." The **Dow Jones Industrial Average** has seen sharper declines compared to tech-heavy indices. Volatility is rising as market participants demand a higher risk premium for geopolitical and policy uncertainty. In the bond market, the **10-year Treasury yield** eased slightly to **4.075%**, down from a high of **4.106%** late last week. Despite the slight dip, yields remain elevated as the market reassesses the long-term inflationary impact of the revised trade duties. Commodities and Energy Precious metals are the primary beneficiaries of the current risk-averse sentiment. Spot **Gold** prices surged **1.61%** today, trading near **$5,160** per ounce. **Silver** outperformed with a massive **5%** rally, reaching **$86** per ounce. Analysts note that gold has established a firm short-term base near the **$5,000** psychological level. Bullion is finding strong support from a combination of trade friction and rising tensions in the Middle East. Energy markets are reflecting a mixed outlook. **Brent Crude** futures are trading around **$71** a barrel, while **WTI** sits at **$65.75**. While geopolitical risks provide a floor, Goldman Sachs has maintained a surplus forecast of **2.3 million** barrels per day for 2026, which may cap significant price gains. Digital Assets and Currency The cryptocurrency market is experiencing a "bearish bias" as appetite for risk assets wanes. **Bitcoin** dropped more than **4.5%** to start the week, sliding toward the **$65,000** support area. Market sentiment in the crypto space has plunged into "extreme fear," with indicators dropping to levels not seen in months. The **$70,000** mark now serves as a formidable near-term resistance level. In the currency space, the **U.S. Dollar** has shown some weakness following the court ruling, allowing the **EUR/USD** pair to climb above the **1.18** handle. Central Bank Outlook The Federal Reserve remains in a holding pattern with the target rate at **3.50%–3.75%**. While the Fed paused its rate-cutting cycle in January, the market is looking toward potential cuts in March or June if labor data softens. Upcoming U.S. data, including Consumer Confidence and GDP revisions, will be critical in determining if the current economic slowdown necessitates a more dovish pivot later this year.