Bearish News
Collection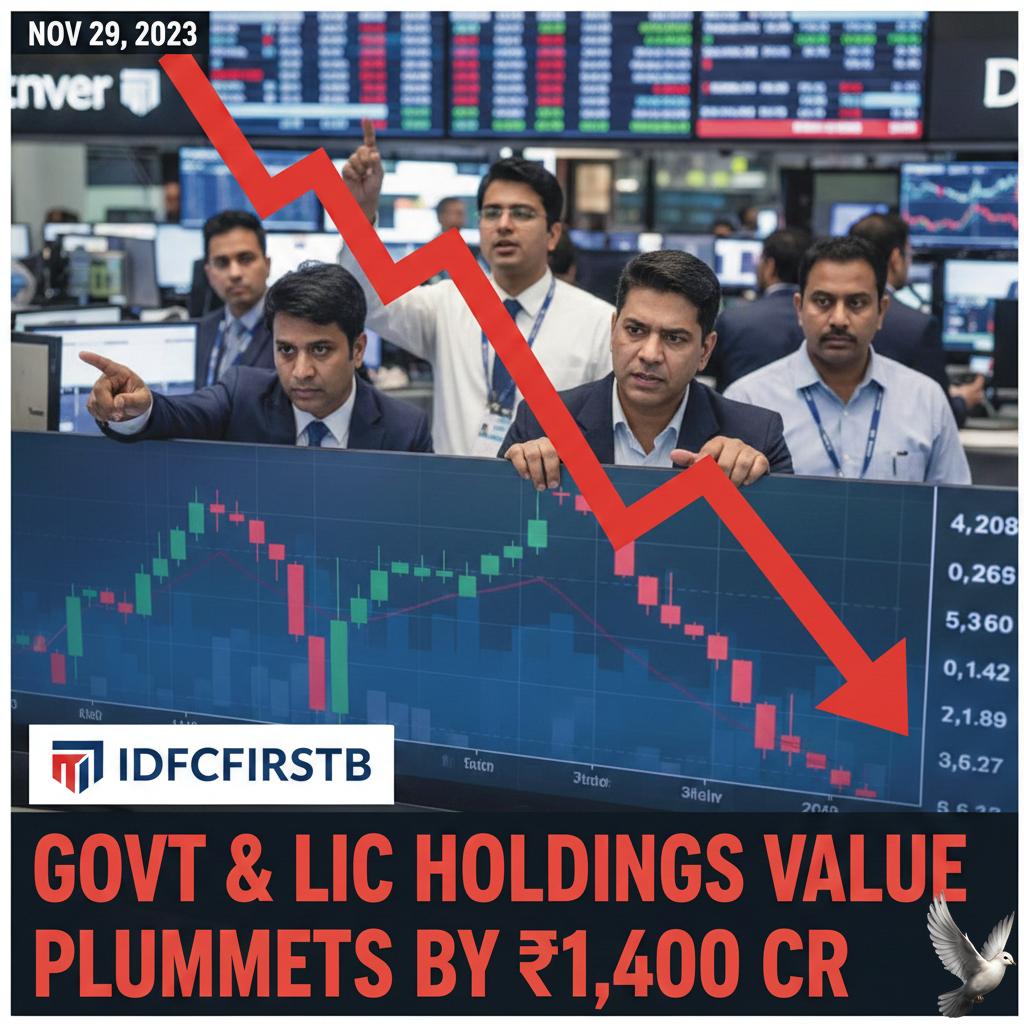
IDFC First Bank Share Decline Reduces Value of Government and LIC Holdings by Over Rs 1,400 Crore
IDFC First Bank shares witnessed a significant collapse on February 23, 2026, with the stock price plunging nearly 20% in intraday trading. The sharp sell-off followed the bank’s disclosure of a potential Rs 590 crore fraud at its Chandigarh branch. The stock hit a low of Rs 66.80 before stabilizing near Rs 70.00, marking a 16% decline from its previous close of Rs 83.51. This volatility erased approximately Rs 14,000 crore in market capitalization in a single session. The fraud involves unauthorized activities by certain employees at the Chandigarh branch, specifically targeting accounts linked to the Haryana government. Discrepancies were first noticed when a state department requested an account closure, revealing a mismatch between the entity's records and the bank’s internal ledger. As a result, the Haryana government has de-empanelled IDFC First Bank and AU Small Finance Bank from handling state business with immediate effect. New rules now require departments to prioritize nationalized banks for public funds. Financial implications for major institutional investors are substantial. The Life Insurance Corporation of India (LIC) and the Government of India have collectively faced mark-to-market losses estimated at Rs 1,452 crore due to the price crash. The Rs 590 crore amount under reconciliation represents roughly 28% of the bank's projected profit for the 2026 fiscal year. While the management has suspended four officials and appointed KPMG for a forensic audit, the incident has intensified governance concerns regarding branch-level controls. Despite the localized nature of the incident, the Reserve Bank of India is actively monitoring the situation. RBI Governor Sanjay Malhotra stated that while the regulator is watching developments closely, there are no immediate signs of a systemic risk to the broader banking sector. IDFC First Bank maintains that it remains well-capitalized with a Capital Adequacy Ratio of 16.22%. The lender reported a net profit of Rs 503 crore for the December 2025 quarter, reflecting a 48% year-on-year growth before this incident surfaced. Market analysts suggest the stock may remain under pressure until the forensic audit provides clarity on the exact financial impact and recovery potential. The bank has already initiated lien-marking on suspicious beneficiary accounts at other institutions to mitigate final losses.
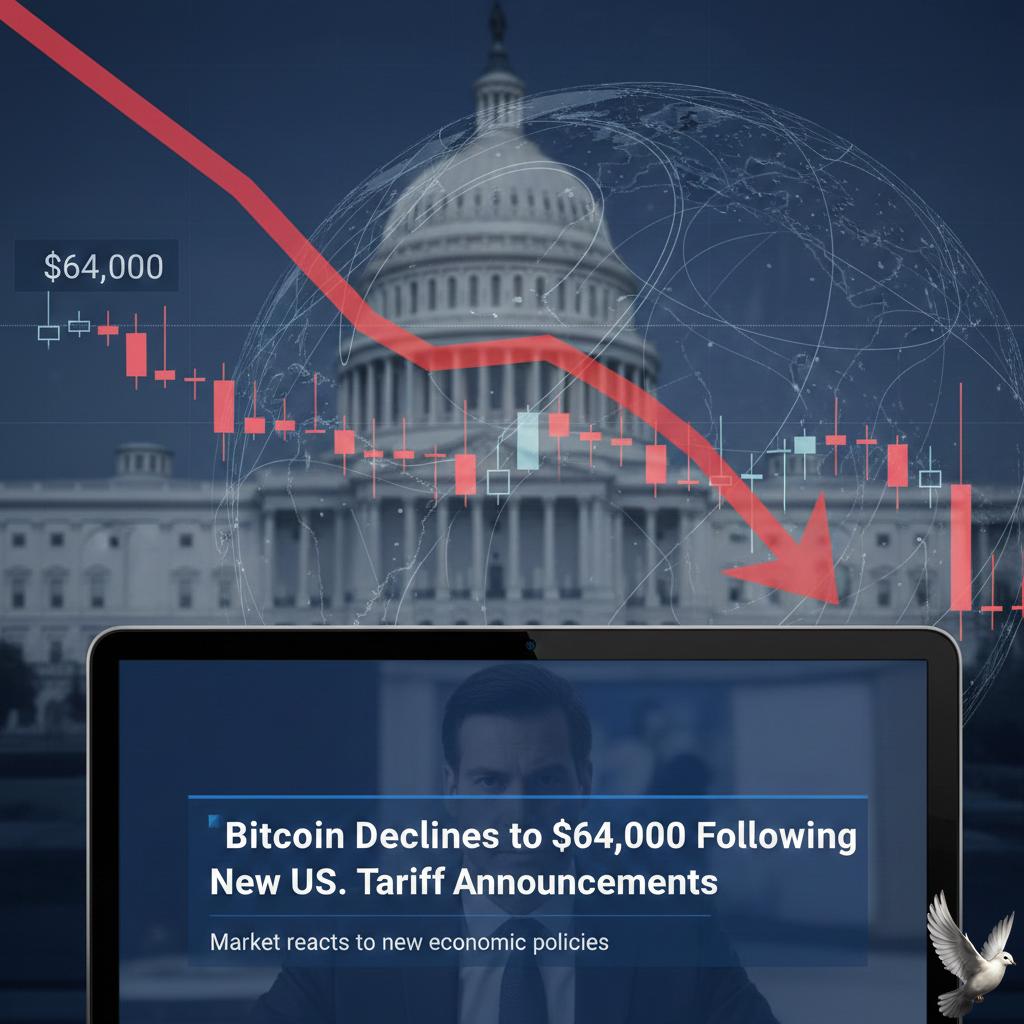
Bitcoin Declines to $64,000 Following New U.S. Tariff Announcements
The cryptocurrency market is navigating a period of intense volatility as of February 23, 2026. Major assets have faced a steep correction following recent shifts in U.S. trade policy and macroeconomic uncertainty. Bitcoin has retreated below the key 65,000 level, currently trading near 64,300. This represents a decline of approximately 4.8% over the last 24 hours. The sell-off has effectively erased gains made over the previous weekend and puts the digital gold nearly 48% below its record high of 126,100 reached late last year. Ethereum is experiencing similar pressure, sliding roughly 5.2% to trade around 1,970. The second-largest cryptocurrency remains vulnerable as broader market sentiment shifts toward a risk-off stance. Other prominent assets like XRP and Cardano have also posted losses as investors pull capital from speculative markets. The primary catalyst for this downturn is the announcement of a 15% global tariff on imports. This move follows a U.S. Supreme Court ruling that limited previous executive trade powers. The decision to raise the baseline tariff from 10% to 15% for a 150-day period has unsettled global financial markets, leading to a sharp drop in U.S. equity futures and digital assets. Market dynamics show a significant spike in liquidations. Over 136,000 traders were liquidated in the past 24 hours, totaling 458 million in losses. Most of these positions—roughly 92%—were leveraged longs, indicating a rapid flush-out of bullish bets. The global crypto market capitalization now stands at approximately 2.33 trillion. Analysts are closely watching the 60,000 support level for Bitcoin. A failure to hold this psychological floor could lead to a deeper correction toward the low-50,000 range. Sentiment indicators have plummeted to historic lows. The Crypto Fear and Greed Index currently sits at 5 out of 100, signaling extreme fear. This level of market pessimism has only been seen three times since 2018, often coinciding with major capitulation events. Whale activity has also increased, with on-chain data showing large holders moving coins onto exchanges. This trend typically precedes further selling pressure. Despite the immediate gloom, some analysts view the current Sharpe Ratio lows as a potential zone for long-term accumulation. Investors are now pivoting their focus toward upcoming economic data, including U.S. Producer Price Index figures and fourth-quarter GDP aggregates. These reports will likely dictate whether the current "buy-on-dips" or "sell-on-rallies" trend persists through the end of the quarter.

Jefferies Downgrades Six Indian IT Stocks Citing Potential Valuation Derating Up to 65%
Major Indian IT stocks faced sharp volatility in late February 2026 as analysts warned of a deepening structural crisis. Market heavyweight Jefferies has turned notably cautious, downgrading key players and projecting a potential **65% valuation downside** in a worst-case scenario. The Nifty IT index has already slumped **16%** year-to-date, significantly underperforming the flat Nifty 50. The sector's combined market capitalization recently dropped by over **₹1.9 lakh crore** in a single trading session, reflecting intense investor anxiety. Core Disruption Factors Structural risks are centered on the rapid evolution of generative AI, which is expected to trigger revenue deflation. Traditional application development and maintenance—accounting for **22% to 45%** of large-cap revenue—faces shrinking billable hours and lower pricing power. The shift toward outcome-based pricing is replacing the long-standing headcount-based outsourcing model. Analysts expect this transition to increase cyclicality and demand a complete overhaul of talent and delivery structures. Stock Performance and Ratings * **TCS:** Market cap slipped below the **₹10 lakh crore** mark for the first time since 2020. The stock hit a 52-week low near **₹2,686**, with target prices slashed to **₹2,350**. * **Infosys:** Shares plunged **13%** over two sessions to hit a low of **₹1,281.50**. Ratings were cut from "Buy" to "Hold" with a revised target of **₹1,290**. * **HCL Tech:** Downgraded to "Hold" as target multiples compressed. The stock fell over **5%** recently, trading near **₹1,436**. * **Wipro:** Remains at "Underperform" with a target price reduced to **₹180**. Mid-Cap Outlook While large-caps struggle with legacy models, select mid-sized firms are preferred for their agility. Firms like **Coforge**, **Sagility**, and **IKS Health** are expected to deliver a **19% to 25%** earnings CAGR between 2026 and 2028. Smaller players are seen as better positioned to pivot toward high-value AI consulting and implementation. Despite this, the broader sector faces immediate headwinds from high US interest rates and reduced discretionary tech spending by American clients. Future Projections Jefferies has lowered earnings estimates for the sector by **1% to 4%**. Current valuations still carry a **32%** premium over global peers like Accenture, despite significantly lower growth projections. The sector is entering a period of "revenue deflation" where AI tools automate routine tasks, requiring fewer engineers to deliver the same outcomes. Markets are now recalibrating to factor in a projected **6%** earnings CAGR for large-cap firms through 2028.

Geopolitical Risks and Supply Levels Impact Indian Bond Market Performance
Indian government bond yields remained elevated as the market navigated a heavy supply of new debt and simmering geopolitical tensions. The benchmark **10-year** 2035 bond yield hovered near **6.71%**, following a significant **4 basis point** jump in the previous session—its sharpest single-day rise in two weeks. Domestic sentiment is currently weighed down by a massive influx of government paper. State governments are scheduled to raise **₹445.5 billion** ($4.91 billion) this week, marking the largest weekly debt sale of the season. This is closely followed by the central government's planned auction of **₹320 billion** in dated securities, including the **10-year** benchmark. [Image of hydrogen fuel cell] While easing crude oil prices provided a momentary reprieve, broader risks persist. Brent crude recently fell **1%** toward **$71 per barrel**, yet prices remain near six-month peaks. This volatility, coupled with fresh U.S. trade levies and uncertainties surrounding Iran, has kept risk appetite for sovereign debt restricted. Monetary policy remains a balancing factor. The Reserve Bank of India (RBI) recently maintained the repo rate at **5.25%** and kept its stance "neutral." While the central bank signals flexibility for future rate cuts, it has modestly revised its inflation outlook. Headline CPI is projected at **3.2%** for the current quarter, with expectations of it rising toward **4.0%** in the first half of the next fiscal year. Foreign interest provides a modest cushion. Foreign Portfolio Investors (FPIs) infused approximately **₹317.42 billion** into Indian capital markets this month, with debt instruments attracting steady interest. Despite these inflows, the sheer volume of upcoming auctions continues to cap any significant rally in bond prices.
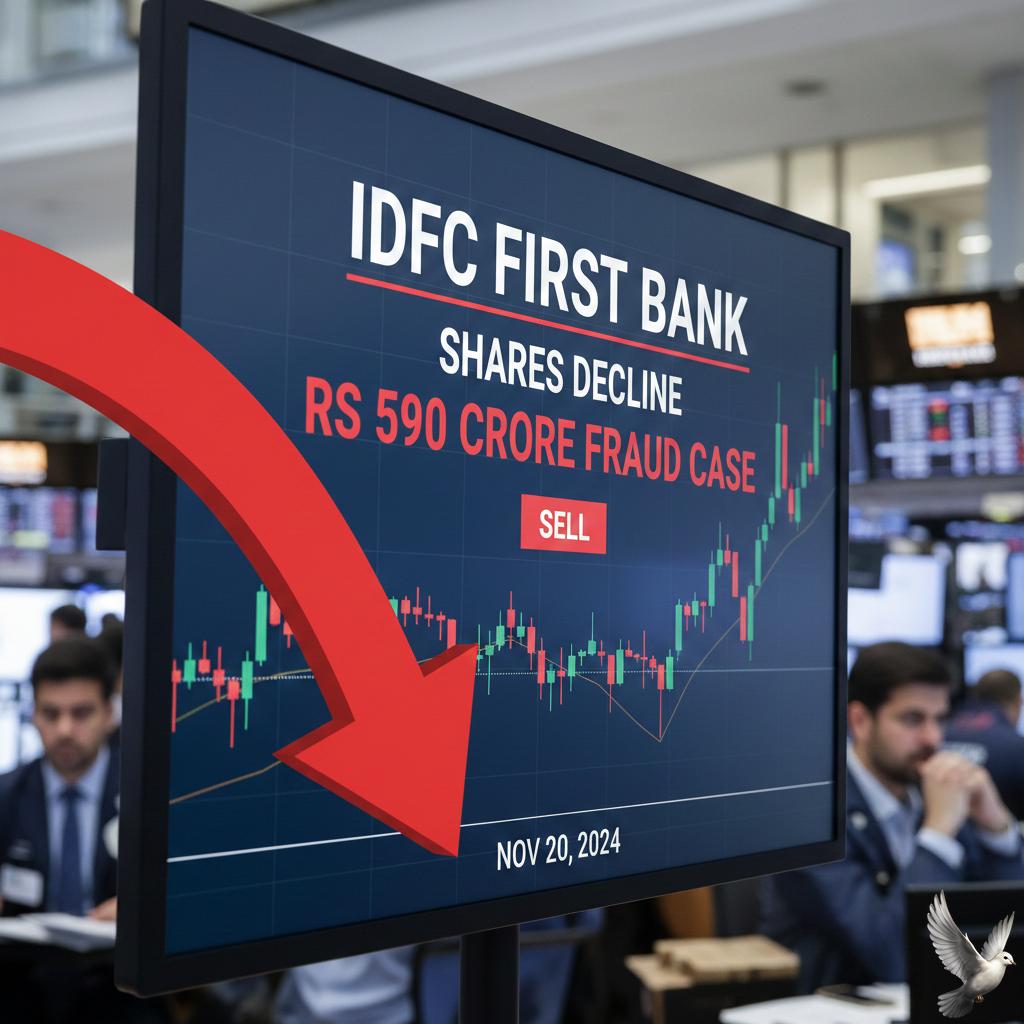
IDFC First Bank Shares Decline Following Reported Rs 590 Crore Fraud Case
Market Brief: IDFC First Bank Sector Alert Shares of **IDFC First Bank** experienced a severe sell-off during early trade on **Monday, February 23, 2026**, as investors reacted to a major internal security breach. The bank’s stock price crashed nearly **20%**, hitting the lower circuit shortly after the market opened. This sharp decline follows the discovery of a **Rs 590 crore** fraud at the bank’s **Chandigarh branch**. The incident involves unauthorized and fraudulent activities linked to a specific group of accounts belonging to the **Government of Haryana**. Key Financial Impact The market valuation of the lender took a massive hit, shedding approximately **Rs 14,438 crore** in a single session. Prior to this event, the bank had maintained a market capitalization of roughly **Rs 71,855 crore**. While the bank recently reported a robust **48%** year-on-year surge in net profit for **Q3 FY26**, analysts warn that the fraud may necessitate significant additional provisions in the coming quarters. This could potentially dampen the bank's near-term earnings growth despite its strong **51.6%** CASA ratio. Government De-empanelment The fallout has escalated beyond the stock market. The **Haryana State Government** has officially de-empanelled IDFC First Bank for all state-level business. A notification issued on **February 18, 2026**, prohibits any further parking, depositing, or transacting of government funds through the lender. This move signals a deep loss of institutional confidence, as state departments are now directed to shift funds exclusively to nationalized banks. Corrective Measures and Investigation The bank has characterized the fraud as an "isolated incident" confined to government-linked accounts at one specific branch. In response, management has initiated the following actions: * **Suspension of four officials** suspected of involvement or negligence. * **Appointment of KPMG** as an independent external agency to conduct a comprehensive forensic audit. * **Police complaints filed** to pursue criminal action against internal and external parties. * **Recall requests sent** to other banks to freeze funds in suspicious beneficiary accounts. The bank is scheduled to hold a stakeholder conference call today, **February 23**, to provide further clarity on recovery efforts and the potential final impact on its balance sheet. Regulatory scrutiny is expected to intensify as authorities investigate how such a discrepancy went undetected during routine reconciliations.

US Market Dynamics: Impacts of Tariff Developments and Federal Reserve Outlook on Global and Indian Equities
MARKET BRIEF: TARIFF VOLATILITY AND MONETARY OUTLOOK A landmark U.S. Supreme Court ruling on February 20, 2026, has struck down sweeping Trump-era tariffs, creating a volatile new landscape for global trade. The 6-3 decision determined that the administration overreached its authority by using emergency powers to bypass Congress. This ruling effectively invalidates the "Liberation Day" duties and other levies collected since April 2025. The fiscal implications are immediate. The U.S. Treasury may now be liable for refunds totaling between $142 billion and $175 billion. Analysts suggest this massive capital injection could act as a significant economic stimulus, representing nearly 0.5% of GDP. However, the ruling also erases approximately $1.4 trillion in projected tax revenue over the next decade, complicating long-term federal budget planning. Market relief may be short-lived as the administration pivots to alternative legal pathways. A new 10% global "stopgap" tariff has already been signaled under Section 122 of the Trade Act, which allows for temporary 150-day surcharges. While the average trade-weighted tariff is expected to drop from 15.3% to roughly 8.3% in the near term, businesses remain in a defensive posture due to this "policy whiplash." The Federal Reserve is monitoring these developments closely as it balances cooling inflation with renewed trade uncertainty. January 2026 data showed headline inflation slowing to 2.4%, the lowest level in months. Despite this, core inflation remains sticky at 2.5%, and the potential for a fresh 10% global levy threatens to reignite price pressures in late 2026. Current market pricing indicates that investors still anticipate two rate cuts this year. However, the Federal Reserve’s January minutes revealed a hawkish undertone, with officials concerned that persistent service-sector inflation and shifting trade costs could necessitate holding the federal funds rate at its current 3.5%–3.75% range for longer than expected. Corporate sectors are seeing mixed impacts. Retail and manufacturing firms, particularly in the footwear and automotive industries, stand to gain from potential duty refunds and lowered import costs. Conversely, the uncertainty surrounding the 150-day expiration of new "stopgap" measures is hindering long-term capital expenditure and supply chain restructuring. Investors should watch for the upcoming February CPI release and the implementation of new executive orders. The shift from broad emergency tariffs to targeted national security and "unfair practice" duties suggests that while the total tax burden may decrease, the complexity of navigating U.S. trade policy will remain a primary driver of market risk through the second half of 2026.
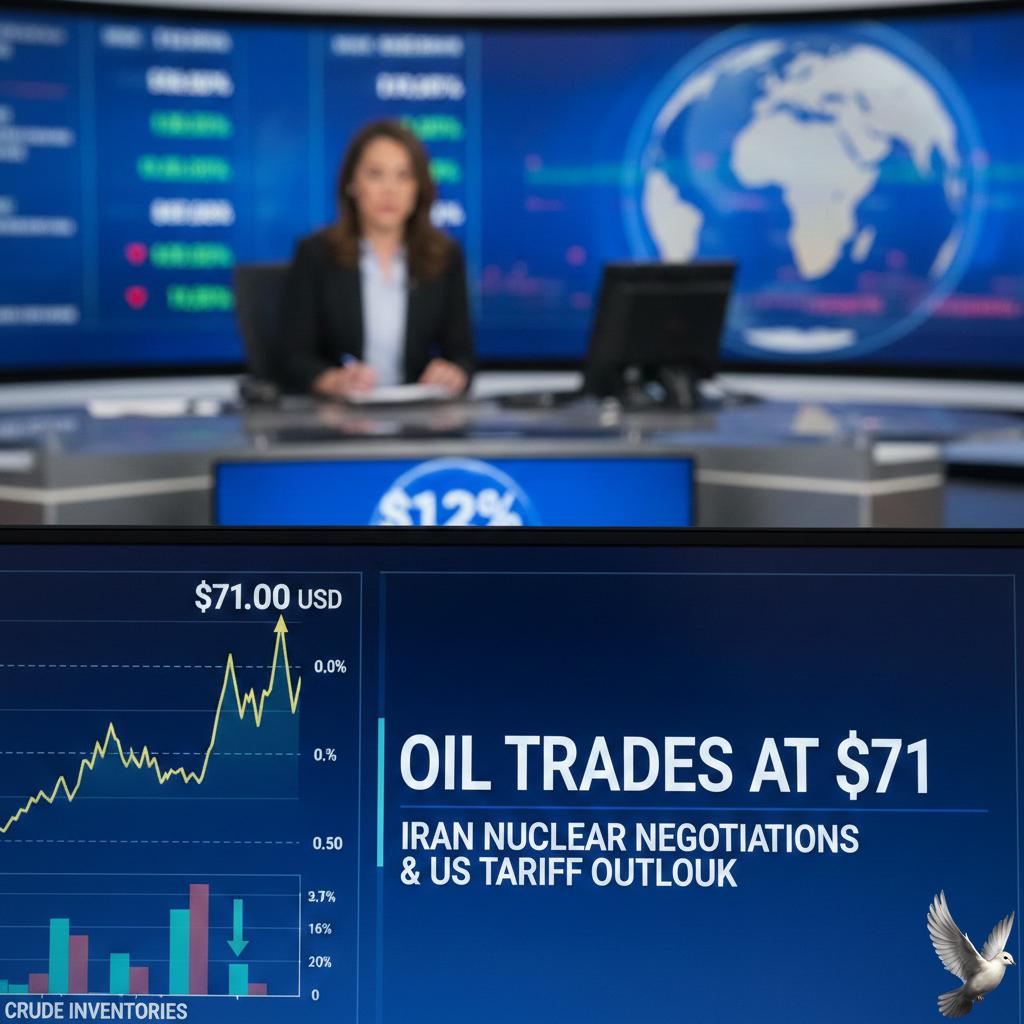
Oil trades at $71 as markets weigh Iran nuclear negotiations and US tariff outlook
Energy markets are navigating a period of sharp volatility as of February 23, 2026. Global crude prices have retreated from recent six-month highs following a pivot toward diplomacy between Washington and Tehran. Brent crude futures fell 76 cents, or approximately **1.06%**, to settle near **$71.00** per barrel. Simultaneously, West Texas Intermediate (WTI) dropped 74 cents, or **1.11%**, to trade at **$65.75**. This pullback follows a week where prices surged more than **5%** on fears of active military engagement. Geopolitical De-escalation The primary driver for the price dip is the announcement of a third round of nuclear talks scheduled for Thursday in Geneva. Reports indicate that Iran may be willing to offer concessions regarding its enrichment programs in exchange for sanctions relief. This diplomatic shift has temporarily reduced the "war premium" that had been baked into prices. Investors had previously braced for strikes on Iranian government sites, which had pushed Brent above the **$72.00** mark just days ago. Trade Policy and Demand Concerns Adding to the downward pressure is the introduction of a new **15%** global tariff by the U.S. administration. This measure follows a recent court ruling that struck down previous trade structures. Market participants view these tariffs as a potential hurdle for global economic growth. Analysts estimate that higher trade costs could dampen fuel demand by roughly **1 million barrels per day** through the remainder of 2026. Supply Risks and Military Presence Despite the cooling sentiment, several factors prevent a deeper slide in prices. The U.S. has maintained a significant naval presence in the Middle East, including the deployment of a carrier strike group. This military buildup remains a critical point of concern for the Strait of Hormuz. Approximately **20%** of the world’s petroleum liquids pass through this narrow waterway daily. Any disruption to this corridor would likely send prices toward triple digits. Market Outlook Current inventories remain tight, with U.S. crude stockpiles recently falling by **9 million barrels**. While OPEC+ is considering a gradual production increase for the second quarter of 2026, the market remains in a state of "backwardation," where near-term supply is valued higher than future deliveries. Economic indicators suggest a surplus of **2.3 million barrels per day** could emerge later this year if geopolitical tensions fully resolve. However, for the immediate term, the balance between Geneva’s diplomatic outcomes and the physical security of Gulf shipping routes remains the decisive factor for price direction.
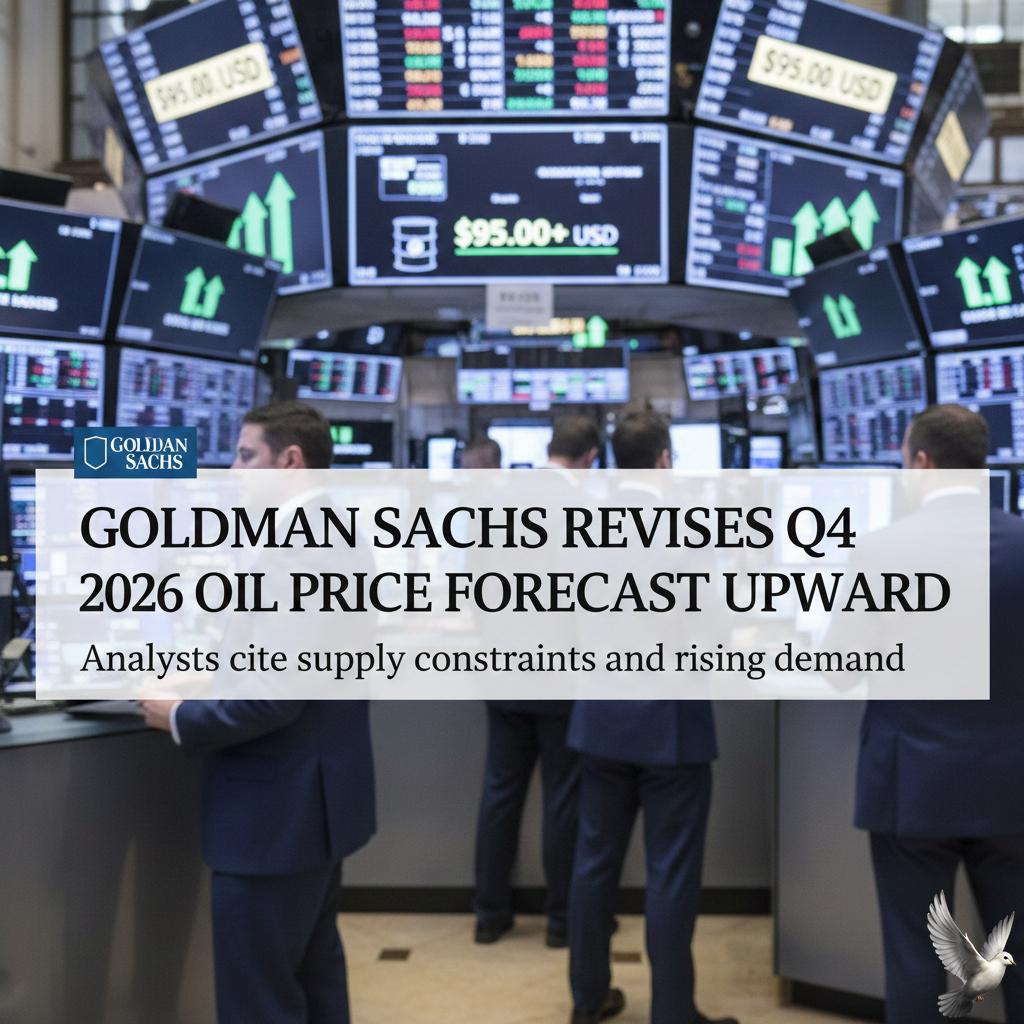
Goldman Sachs Revises Q4 2026 Oil Price Forecast Upward
The global oil market is currently navigating a period of heightened volatility, driven by shifting geopolitical risks and revised long-term supply forecasts. As of February 23, 2026, benchmark prices have seen a slight retreat following a week of significant gains. Brent crude is currently trading at approximately **$71.00** per barrel, down about **1.05%** today. Similarly, West Texas Intermediate (WTI) has dipped to **$65.74**, a decline of **1.11%**. This softening follows a rally that pushed prices to six-month highs earlier in the month. The immediate price pressure stems from a blend of diplomatic and trade factors. Risk aversion has surfaced following the announcement of new U.S. tariff hikes, raising concerns about global fuel demand. Simultaneously, the scheduled third round of nuclear talks between the U.S. and Iran in Geneva has slightly deflated the geopolitical risk premium, which was previously estimated at **$6** per barrel. In a significant long-term shift, Goldman Sachs has revised its 2026 price projections upward. The bank now expects Brent to reach **$60** and WTI to hit **$56** per barrel by the fourth quarter of 2026. This is a **$6** increase from previous estimates, primarily justified by lower-than-expected stockpiles across OECD nations. Inventory levels at major pricing centers have failed to accumulate as predicted, creating a tighter baseline for the coming year. While a global surplus is still anticipated for 2026, Goldman Sachs suggests this may be the final year of the current supply growth cycle. OPEC+ strategy remains a critical pillar for market stability. The alliance recently reaffirmed its decision to pause production increases through the first quarter of 2026, citing seasonal demand weakness. However, there are growing indications from member nations like Saudi Arabia and the UAE that supply hikes could resume as early as April 2026 to reclaim market share. Current data shows global oil production reached **106.6 million** barrels per day in January, with total 2026 output projected to rise by **2.4 million** barrels per day. Demand growth remains concentrated in non-OECD economies, with China and India expected to drive consumption increases of **0.2 million** and **0.3 million** barrels per day, respectively. Market participants are closely watching the March 1 OPEC+ meeting, where a formal decision on production levels for the second quarter will be finalized. For now, the combination of low OECD inventories and persistent Middle East tensions provides a floor for prices, even as macroeconomic headwinds test the ceiling. [Oil Market Outlook 2026](https://www.google.com/search?q=https://www.youtube.com/watch%3Fv%3DF_YF-L3kP0I) This video provides a deep dive into the factors influencing 2026 oil price forecasts and the strategic production shifts expected from major global players.
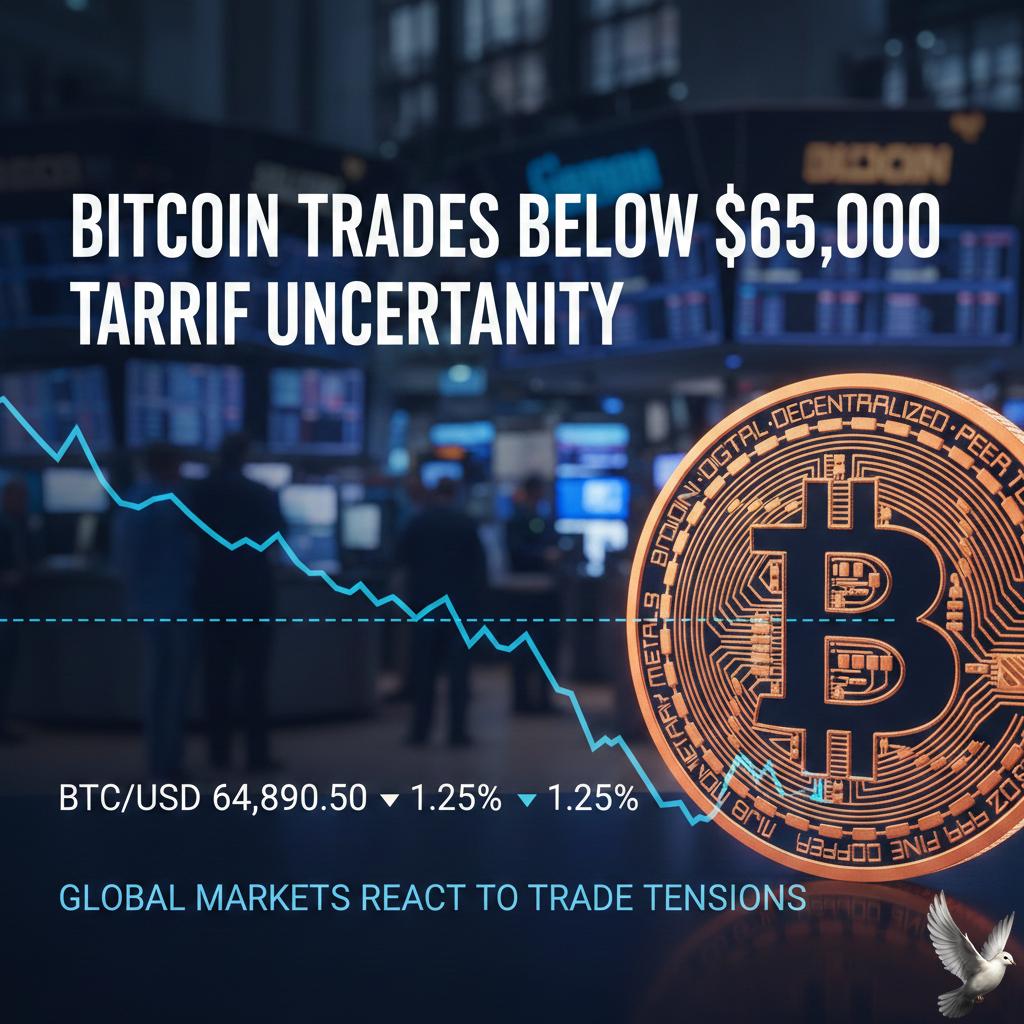
Bitcoin trades below $65,000 amid tariff uncertainty
Market Brief: Digital Assets Performance Digital asset markets are experiencing a period of renewed volatility as global trade policy shifts and macroeconomic pressures weigh on investor sentiment. Bitcoin Market Action Bitcoin ($BTC) recently faced a sharp decline, dropping nearly **4.8%** to trade around **$64,300**. This move follows a period of tentative stabilization where the asset struggled to maintain momentum above the **$68,000** mark. Trading volume has shown signs of exhaustion, with daily transactions declining to approximately **512,000**, down from previous highs near **700,000**. The total crypto market capitalization has retreated to approximately **203.15 trillion INR** (roughly **$2.45 trillion**), reflecting a **1.42%** decrease over the last 24 hours. Technical Support and Resistance The technical structure remains fragile. Analysts are focusing on the **$60,000** psychological support level, which served as a crucial floor earlier in February. A breach below this point could trigger further liquidations. On the upside, a sustained recovery above **$66,500** and **$68,500** is required to shift the short-term bearish bias. The **$70,000** level stands as a primary resistance zone that bulls must reclaim to signal a broader trend reversal. Macroeconomic and Policy Drivers The downturn is largely attributed to heightened uncertainty surrounding U.S. trade policy. Recent announcements regarding a potential **15%** global tariff under Section 122 of the Trade Act have injected fresh risk premiums into speculative assets. Additional pressure stems from: * **Monetary Policy:** Hawkish signals from recent Federal Reserve minutes have dampened hopes for imminent rate cuts, pushing capital toward safer instruments. * **Institutional Outflows:** Spot Bitcoin ETFs have seen a slowdown in appetite, with recent net outflows of approximately **$133 million**. * **Sentiment:** The Fear and Greed Index has plunged into "Extreme Fear," currently hovering around a reading of **7 to 9**, the lowest level observed since late 2025. Broader Altcoin Performance The altcoin market is mirroring Bitcoin’s weakness. Ethereum ($ETH) continues to trade under pressure below the **$2,000** (approx. **1,77,000 INR**) threshold, while major assets like Solana ($SOL) and XRP have posted daily losses ranging between **2.5%** and **3.5%**. Market participants remain cautious as they await further clarity on implementation timelines for trade duties and upcoming U.S. economic data releases.
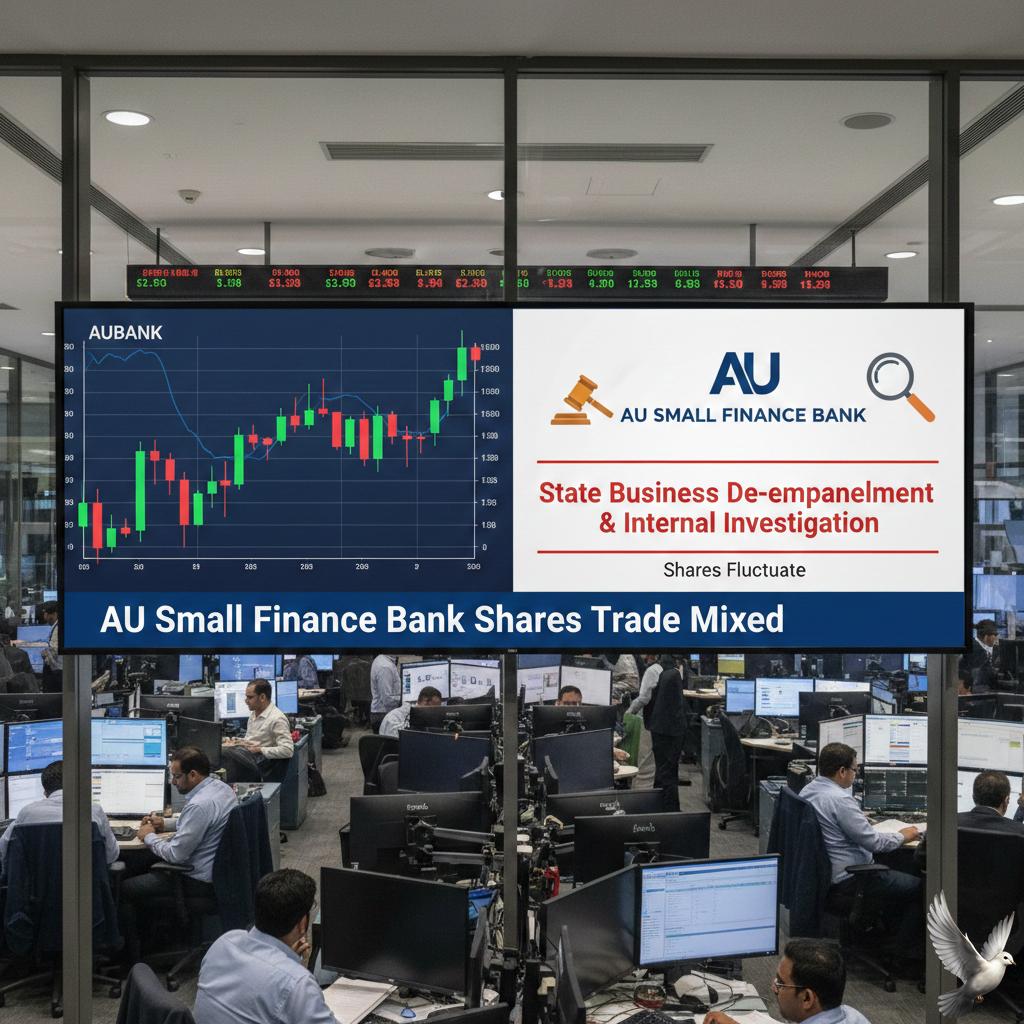
AU Small Finance Bank Shares Trade Mixed Amid State Business De-empanelment and Internal Investigation
Shares of AU Small Finance Bank and IDFC First Bank are under significant pressure following an immediate de-empanelment by the Haryana Government. The decision, effective February 18, 2026, bars both lenders from handling state government business, including deposits, investments, and transactions. The state’s Finance Department has directed all departments, boards, and PSUs to transfer existing balances and close accounts with both banks. A full reconciliation of accounts must be completed by March 31, 2026, with a compliance report due by early April. IDFC First Bank: Fraud Disclosure The action was triggered after IDFC First Bank reported a suspected fraud of 590 crore at its Chandigarh branch. The discrepancy was discovered during a routine request by a Haryana government department to close an account and transfer funds. Preliminary reviews suggest the fraud involved unauthorized activities by specific employees and external individuals. The bank has already suspended four officials and is commissioning an independent forensic audit. The lender maintains that the issue is confined to a specific group of government-linked accounts and does not affect the broader customer base of the branch. AU Small Finance Bank: Clarification and Impact AU Small Finance Bank has clarified that it has found no evidence of fraudulent activity on its part. The bank stated that a government account maintained with it received 47 crore from another private bank that had disclosed fraud. These funds were later transferred out through 14 transactions which the bank claims were duly authorized by the department. The bank’s exposure to Haryana government deposits stood at 735 crore as of February 17. Following the de-empanelment, these deposits dropped to 538 crore by February 21, representing approximately 0.4% of the bank's total deposit base. AU Small Finance has placed certain employees off-duty to ensure a transparent internal review and is actively seeking re-empanelment. Market Performance Despite the regulatory setback, AU Small Finance Bank shares showed resilience, closing at 1,028.75 on February 20, up 1.2% for the session. The stock remains a top performer in the Nifty Bank index over the past year, currently trading well above its 200-day moving average of 838. Analysts are closely monitoring the situation as the Haryana government has also flagged broader concerns. The state noted that several banks have failed to adhere to fixed deposit instructions, allegedly keeping funds in low-interest savings accounts instead of higher-yield flexible instruments, causing financial losses to the exchequer.

IDFC First Bank Discloses ₹590 Crore Fraud at Chandigarh Branch
IDFC First Bank is currently navigating a significant internal crisis following the discovery of a ₹590 crore fraud at its Chandigarh branch. The incident, disclosed to stock exchanges over the weekend, involves unauthorized activities by bank employees specifically targeting accounts linked to the Haryana government. The discrepancy came to light when a Haryana government department requested to close its account and transfer funds to another lender. During the process, the bank observed a mismatch between the reported book balances and the actual funds present. Since February 18, 2026, multiple other state entities have reported similar inconsistencies in their account statements. The bank has clarified that the breach is confined to a specific group of government-linked accounts and does not affect the broader retail or corporate customer base in Chandigarh. In immediate response, four officials have been suspended, and a police complaint has been filed. To ensure a deep-dive investigation, the bank has appointed KPMG to conduct an independent forensic audit. The scale of the fraud is particularly notable as the ₹590 crore figure exceeds the bank's most recent quarterly net profit of ₹503 crore for Q3 FY26. While the bank reported a healthy 48% year-on-year growth in profits last month, this event places renewed pressure on its internal control frameworks. Market analysts are monitoring the situation closely as the bank works to reconcile the exact amount and pursue recoveries. The lender has already initiated "recall requests" to other banks to lien-mark suspicious beneficiary accounts. Despite the news, the stock showed resilience in the most recent trading session, closing at ₹83.51 on the NSE, up approximately 0.64% before the full extent of the disclosure was processed by the broader market. The bank maintains a strong capital adequacy ratio of 16.22% and a high CASA ratio of 51.6%, providing a significant buffer. However, the incident highlights ongoing challenges in branch-level oversight within the private banking sector. Investors are now looking toward a scheduled conference call for further clarity on the potential impact on future provisions and the timeline for legal recovery. [IDFC First Bank fraud news](https://www.youtube.com/watch?v=6j5vpNBjdnk) This video provides a detailed discussion on the rising trends of banking and digital fraud in India, offering expert context on how such incidents impact the financial ecosystem. http://googleusercontent.com/youtube_content/0
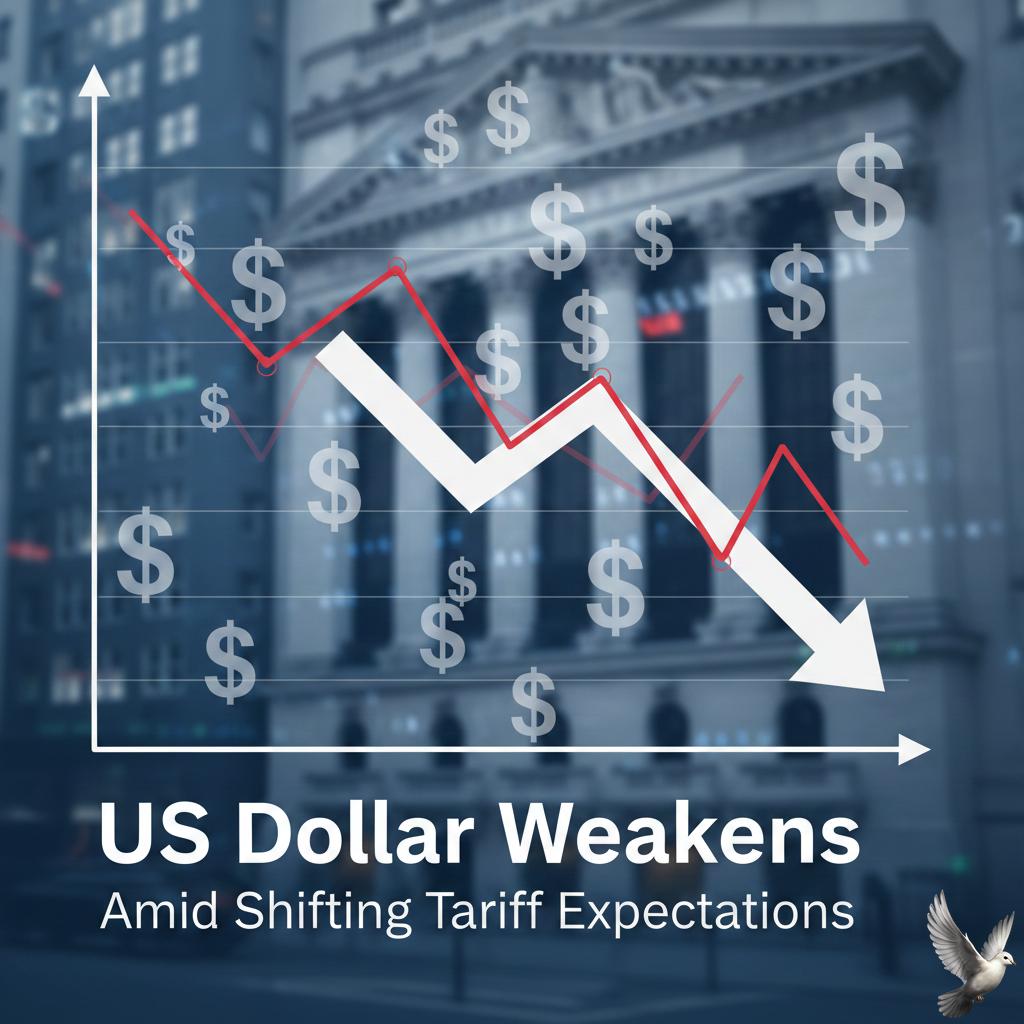
US Dollar Weakens Amid Shifting Tariff Expectations
The U.S. dollar is navigating a period of high volatility following a landmark Supreme Court ruling that struck down President Trump’s sweeping emergency tariffs. While the decision was initially seen as a catalyst for global growth, the market remains cautious as the administration moves to implement replacement levies under alternative legal authorities. The U.S. Dollar Index (DXY) recently tested a 97.89 level, marking its strongest weekly performance in four months. However, the currency remains under pressure as traders weigh the legal constraints now placed on executive trade powers. The court’s 6–3 decision invalidated tariffs imposed under the International Emergency Economic Powers Act (IEEPA), effectively reducing the trade-weighted average U.S. tariff rate from 15.4% to 8.3%. In an immediate countermove, the White House announced a new 10% global tariff under Section 122 of the Trade Act of 1974. This temporary surcharge is slated for 150 days, after which it would require Congressional approval. Market uncertainty has intensified as President Trump subsequently signaled a potential hike of these new levies to 15%, leaving businesses and international partners in a state of flux. The fiscal outlook is further complicated by the potential for $175 billion in customs refunds. Analysts warn that returning these funds to importers could significantly widen the U.S. fiscal deficit, adding a layer of long-term structural weakness for the greenback. Geopolitical tensions are providing a counter-narrative for the dollar’s trajectory. Increasing friction between the U.S. and Iran has pushed Brent crude prices toward 6-month highs, with some projections suggesting a climb to $91 per barrel if supply disruptions persist. These tensions have bolstered safe-haven demand, keeping the dollar and gold—now trading above $5,000—elevated despite the domestic policy setbacks. Equities have shown resilience, with the S&P 500 rising 0.69% and the Nasdaq gaining 0.90% following the ruling. Investors appear to be focusing on the removal of "reciprocal tariffs," which had previously placed heavy burdens on major trading partners like India, where 55% of exports are now expected to be free from 18% duties. Looking ahead, the market focus shifts to the Federal Reserve's next move. With the core PCE price index and fourth-quarter GDP data looming, the Fed's stance on inflation will be critical. Current market pricing shows expectations for only two rate cuts in 2026, a hawkish shift from previous estimates that may continue to provide a floor for the dollar amidst the ongoing trade policy overhaul.
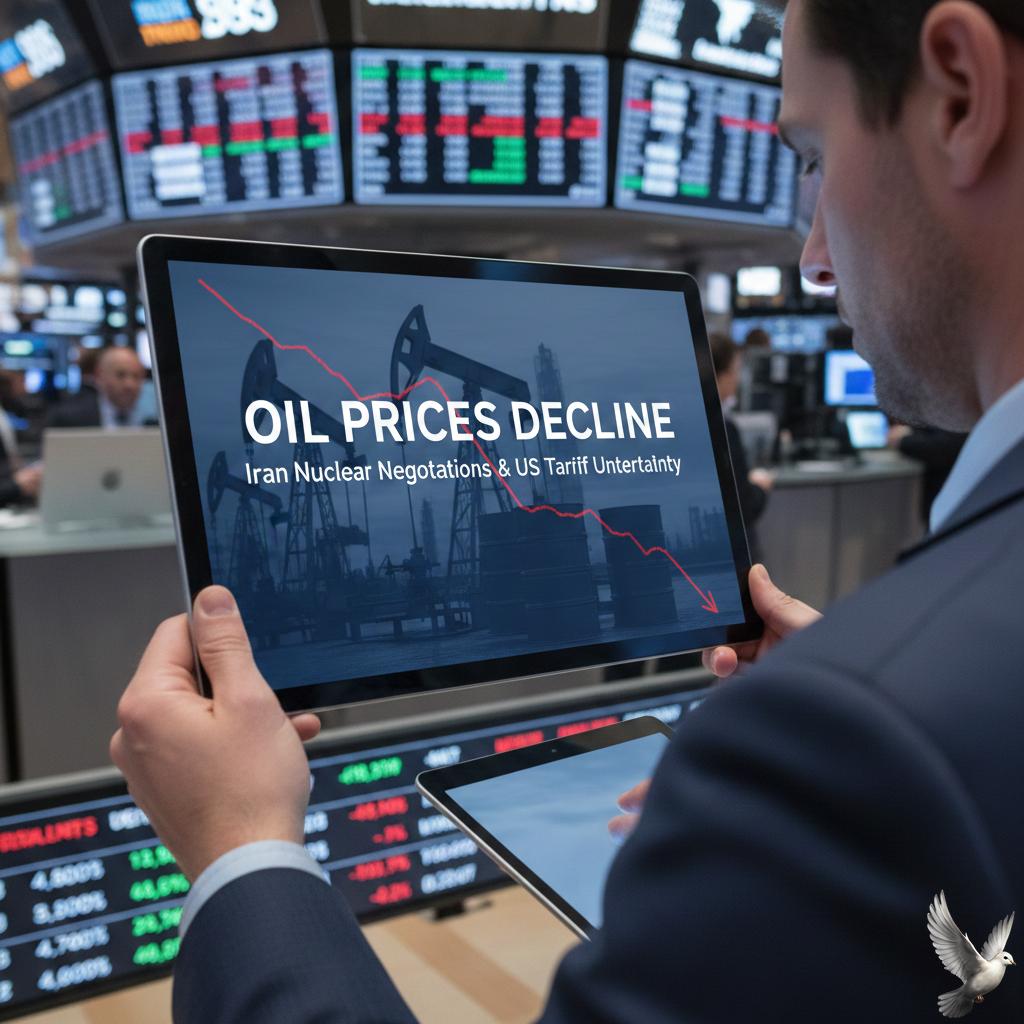
Oil Prices Decline Amid Iran Nuclear Negotiations and US Tariff Uncertainty
Crude oil markets are currently caught in a tug-of-war between escalating Middle East tensions and a shifting U.S. trade policy. Prices recently reached six-month highs as the risk of military confrontation in the Persian Gulf overshadowed bearish supply fundamentals. Brent crude is trading around $72.21 per barrel, reflecting a weekly gain of nearly 6%. U.S. West Texas Intermediate (WTI) has climbed to approximately $67.05, representing a weekly surge of over 5.5%. These levels mark a significant recovery from the $55 range seen earlier this year. Geopolitical risk is the primary driver. The Trump administration has issued an ultimatum to Tehran, giving Iran a 10 to 15-day window to negotiate a new nuclear deal. This diplomatic pressure is backed by the largest U.S. military buildup in the Middle East since 2003, with carrier strike groups moving into the region. The market is pricing in a high "risk premium" due to the vulnerability of the Strait of Hormuz. Roughly 20% of global oil and 20% of LNG trade passes through this chokepoint. Analysts warn that a limited disruption to Iranian exports could add $10 to $12 to per-barrel prices, while a full blockade of the strait could push oil past $130. On the economic front, President Trump has introduced fresh uncertainty by signing a proclamation for a 10% global import surcharge. This move follows a Supreme Court ruling that invalidated previous emergency levies. The president has already signaled an intent to raise this tariff to 15% effective immediately. These trade barriers are expected to dampen global growth and fuel demand. The IEA has already revised its 2026 demand growth forecast down to 850,000 barrels per day. While demand slows, a supply surplus is looming; total global liquids inventories are projected to build by over 4 million barrels per day in the second quarter of 2026. OPEC+ remains a stabilizing force for now. The group has reaffirmed its decision to pause production increases through March 2026. However, the combination of slowing demand and rising production from non-OPEC+ sources creates a complex outlook for the remainder of the year. While the "energy phase" of the current commodity supercycle appears to be underway, the market remains on a knife-edge. Traders are closely monitoring the 15-day deadline for Iran, as any transition from diplomatic pressure to kinetic action would likely trigger immediate volatility.

Pre-Market Analysis and Trading Outlook for the Current Session
Global markets are adjusting to a high-stakes legal shift in Washington after the U.S. Supreme Court struck down a series of broad trade tariffs. In a 6-3 ruling, the court determined that the administration lacked the constitutional authority to impose wide-ranging levies under existing emergency powers, returning the power of taxation to Congress. In an immediate response to the verdict, the White House announced a new temporary global import surcharge of 10% under Section 122 of the Trade Act of 1974. This "stopgap" measure is limited to a 150-day window unless extended by a congressional vote. This pivot from a previous average tariff rate of roughly 17% down to 10% has triggered significant volatility across international trade hubs. Asian equity markets reacted with mixed sentiment as the new week began. Japan’s Nikkei 225 index faced downward pressure, sliding 1.17% to close near the 56,792 level. Investors in Tokyo remain cautious as the reduction in U.S. tariffs is offset by the 150-day expiration risk and the potential for a more chaotic, unpredictable trade environment. In contrast, Australia’s ASX 200 showed resilience, maintaining a position above the 9,025 mark. While the index saw some intra-day softening, it remains supported by strong half-year corporate earnings, particularly from the mining sector. The Australian market is also weighing a hawkish stance from the Reserve Bank of Australia, which recently raised the cash rate to 3.85% to combat persistent inflation. The Indian rupee continues to trade under stress against a strengthening U.S. dollar. The currency is currently hovering near the 90.75 to 91.00 range. Despite the Supreme Court ruling theoretically lowering the tariff burden on Indian exports from 18% to 10%, the rupee remains sensitive to broader emerging market capital outflows and global trade uncertainty. Commodities have emerged as a primary hedge against this instability. Gold has seen a notable surge, firmly crossing the $5,100 per ounce threshold. The metal has benefited from a weakening dollar and the billions of dollars in potential tariff refunds now hanging over the U.S. Treasury, which total an estimated $264 billion from 2025 alone. Market participants are now focusing on upcoming economic indicators to gauge the next move. Critical data points include fourth-quarter GDP figures from India and Switzerland, as well as February inflation data from major European economies. With the new 10% surcharge set to take effect on February 24, supply chains are bracing for a period of intense renegotiation and legal maneuvering.
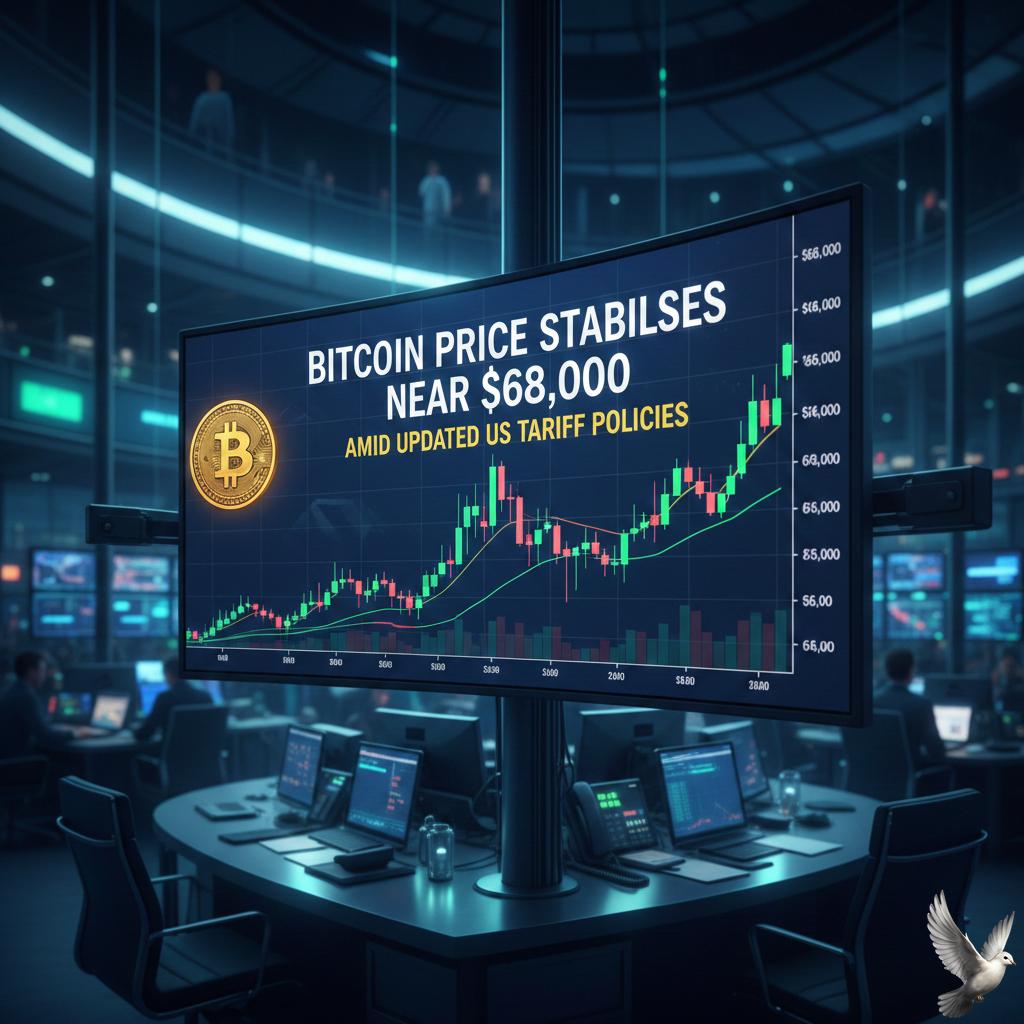
Bitcoin Price Stabilizes Near $68,000 Amid Updated US Tariff Policies
Crypto Market Brief: February 21, 2026 Bitcoin maintains a steady footing near the **$68,000** threshold this Saturday, demonstrating notable resilience against a backdrop of complex macroeconomic shifts. Despite the U.S. Supreme Court recently striking down specific executive tariff powers, the broader climate of trade uncertainty continues to influence risk-asset sentiment. The primary digital asset is currently trading at approximately **$67,830**, navigating a period of intense consolidation. This stability comes even as the sector processes significant institutional movement, with spot Bitcoin ETFs recently recording roughly **$3.8 billion** in outflows over the last four weeks. Technical indicators suggest a tightening range for Bitcoin. Buyers are currently defending a critical support zone between **$65,000** and **$67,000**. On the upside, the asset faces immediate resistance at the **$70,000** psychological barrier, followed by a more formidable technical ceiling at **$73,750**. Ethereum is exhibiting similar consolidation patterns, holding firm near **$1,960**. The second-largest cryptocurrency is currently compressed within a symmetrical triangle pattern, a formation that often precedes a sharp breakout. While it remains below the key **$2,200** resistance level, active network addresses have stabilized as selling pressure from the U.S. market begins to ease. * **Bitcoin (BTC):** $67,830 (+0.35%) * **Ethereum (ETH):** $1,955 (+0.22%) * **Total Market Cap:** $2.3 Trillion Market participants are closely monitoring the derivatives landscape. Approximately **$2.4 billion** in Bitcoin and Ethereum options expired recently, with "max pain" points situated at **$70,000** and **$2,050** respectively. This positioning suggests a potential magnet effect that could pull prices toward these levels if volatility remains controlled. Altcoins have shown moderate strength, with the Fear & Greed Index hovering at an extreme low of **8**, historically a level where contrarian buyers begin to accumulate. While institutional demand has cooled from its early 2025 peaks, on-chain data reveals that long-term whale addresses continue to hold, providing a structural floor for the current market valuation. The near-term outlook remains dependent on upcoming U.S. PCE inflation data scheduled for late February. A sustained move above the **7-day moving average** near **$70,000** for Bitcoin would be required to neutralize the current short-term bearish structure and signal a renewed push toward previous highs.
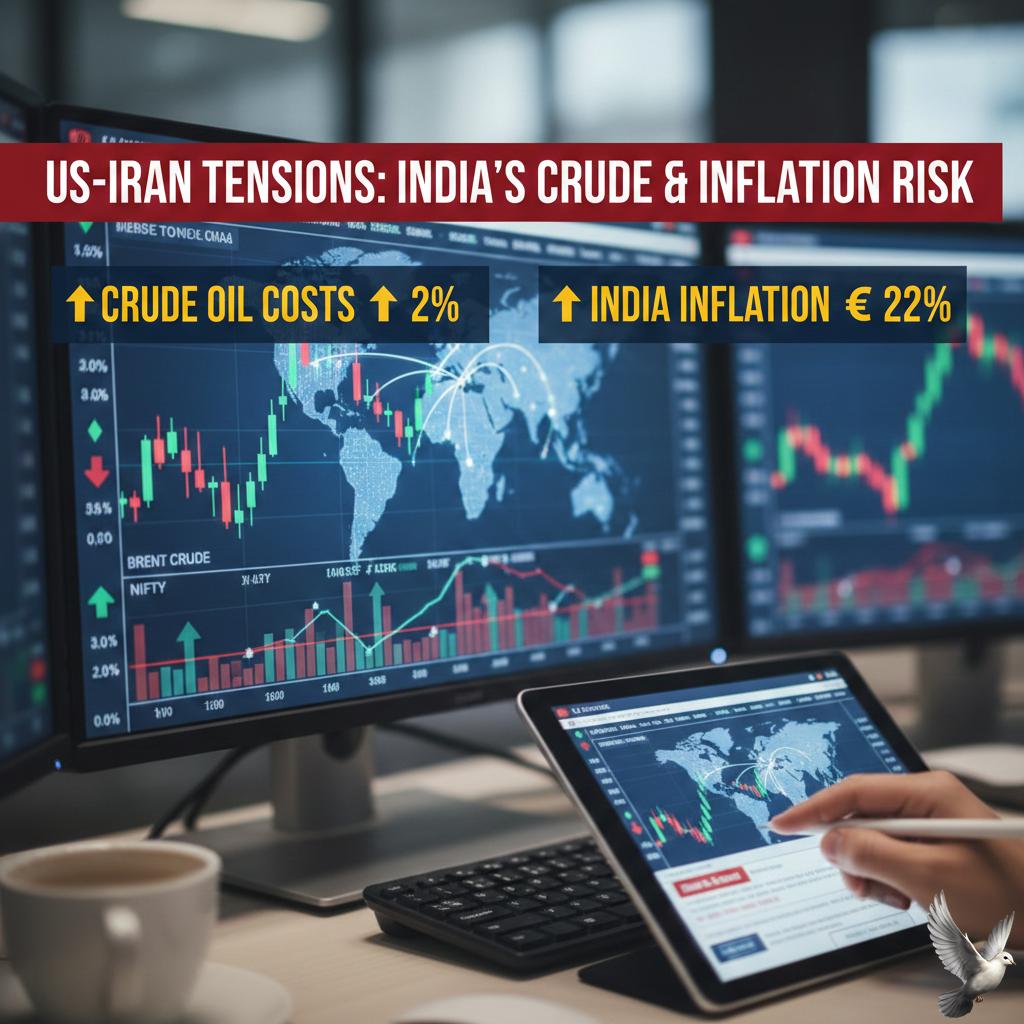
Potential Impact of US-Iran Tensions on India’s Crude Oil Costs and Inflation Rates
Market Brief: Strait of Hormuz Tension and Energy Volatility Geopolitical friction between the United States and Iran has pushed global energy markets to a six-month high. As of **February 21, 2026**, Brent crude is trading near **$71.68** per barrel, marking a sharp recovery of over **12%** within the last month. Market anxiety is centered on a **10-day** ultimatum issued by the U.S. administration for Iran to reach a nuclear agreement, fueling fears of a potential military escalation. The Strait of Hormuz remains the primary global concern. Approximately **20-21%** of the world’s seaborne-traded crude oil and nearly **20%** of global liquefied natural gas (LNG) transit through this **21-mile** wide waterway. Iranian naval exercises and the temporary closure of shipping lanes earlier this week have already triggered a risk premium in pricing, adding an estimated **$5-10** per barrel to current benchmarks. India faces significant economic exposure due to its **87%** import dependency. More than **40%** of India's crude imports pass directly through the Strait of Hormuz. For every **$1** increase in the price of oil, India’s annual import bill expands by approximately **$2 billion**. While the Reserve Bank of India has maintained the repo rate at **5.25%** and projected a manageable inflation rate of **2.1%** for **FY26**, sustained energy price spikes threaten these stability targets. Logistical shifts are already visible as regional risks intensify. Indian refiners have reduced Russian oil imports to roughly **1.2 million** barrels per day, down from peaks of over **2 million**, while increasing intake from Saudi Arabia to **1.1 million** barrels. This diversification aims to mitigate supply chain shocks, but alternative routes like the Cape of Good Hope add **25-30 days** to transit times and up to **$2.25 million** in costs per shipment. Market analysts assign a **70%** probability to a U.S. strike if diplomacy fails. A partial transit disruption could push Brent into the **$85-95** range, while a full chokepoint closure would likely trigger triple-digit pricing. Shipping insurance premiums have already surged **200-400%** above baseline rates, reflecting the heightened risk of maritime incidents in the Persian Gulf. This video provides a deep dive into the maritime geography and historical significance of the world's most critical oil transit point.
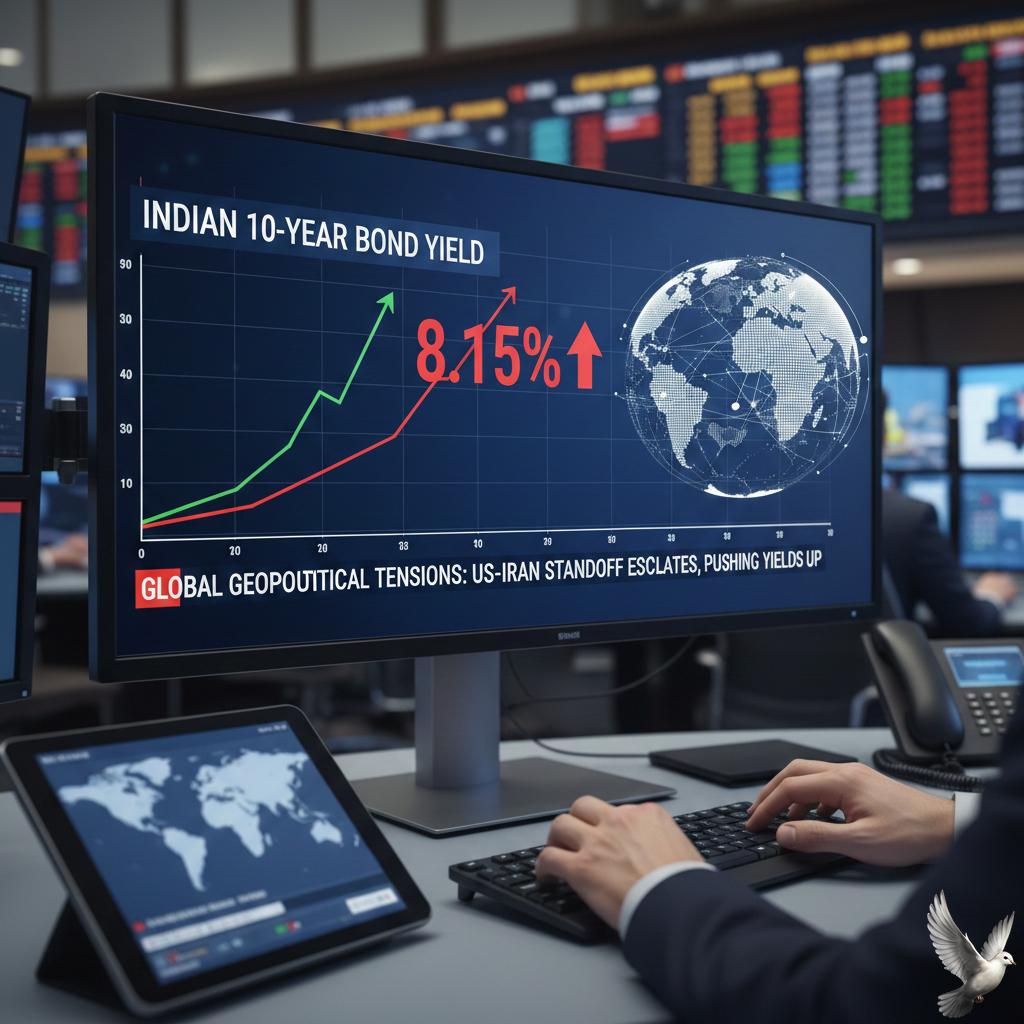
Indian 10-Year Bond Yield Rises Amid Geopolitical Tensions between U.S. and Iran
India's sovereign debt market faced significant selling pressure today as the benchmark 10-year government bond yield climbed to 6.73%, up from its previous close of 6.67%. This spike is primarily driven by escalating geopolitical tensions between the U.S. and Iran, which have pushed energy prices to their highest levels in over six months. Brent crude futures surged toward 71.50 USD per barrel, while the Indian Basket of crude jumped to an average of 68.13 USD for February. Market participants are increasingly concerned that a potential military confrontation could disrupt supply through the Strait of Hormuz, a critical artery for global oil flows. Higher oil prices pose a direct threat to India’s inflation outlook and fiscal deficit, as the country remains heavily dependent on energy imports. The bond market also remains on edge ahead of a planned 330 billion INR government debt auction. Investors are showing heightened caution, leading to a rise in long-term overnight index swap rates and a general pullback from risk-sensitive assets. In the currency market, the Indian Rupee weakened significantly, gapping down to 91.20 against the U.S. Dollar. This depreciation is fueled by the rising cost of dollar-denominated imports and sustained selling by foreign institutional investors. Domestic liquidity conditions continue to be a focus for the Reserve Bank of India. While the central bank recently paused its rate-cut cycle at 5.25%, analysts suggest that any further spike in crude-led inflation could delay future monetary easing and keep yields elevated for the foreseeable future.
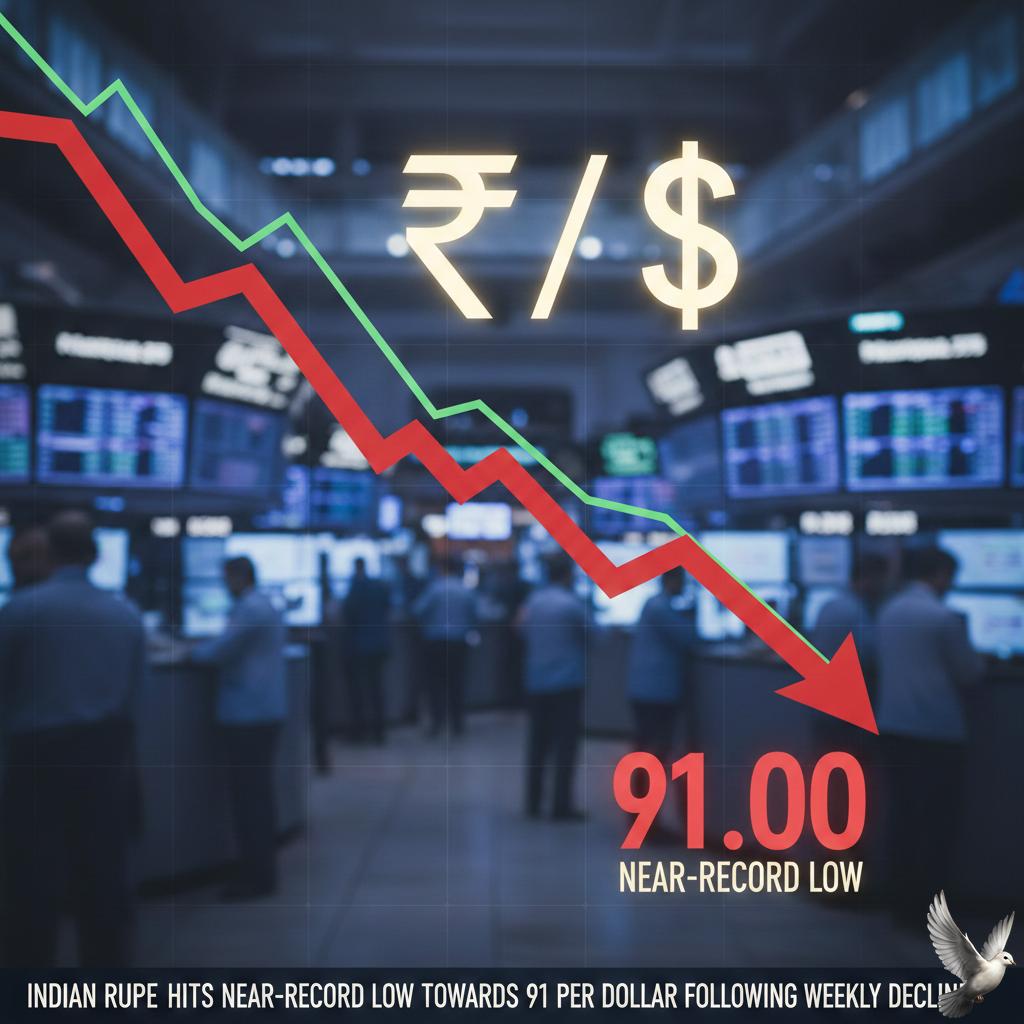
Indian Rupee Hits Near-Record Low Towards 91 Per Dollar Following Weekly Decline
Market Brief: Rupee Under Pressure The Indian Rupee faced significant volatility this week, culminating in a sharp decline that saw the currency settle at **90.99** against the US Dollar on Friday, February 20, 2026. This move represents the steepest weekly fall in a month, as the currency struggled to maintain its footing near the psychologically important **91.00** mark. A primary driver of this depreciation has been a massive surge in capital outflows. Recent data confirms that foreign investors repatriated a record **$7.45 billion** in a single month, the highest on record. While gross inflows remain healthy, the net effect of these repatriations—driven by profit-taking and shifting global strategies—has placed heavy selling pressure on the domestic unit. Strategic Reserve Buffers Despite the currency's slide, India's external sector remains resilient. The Reserve Bank of India (RBI) reported that foreign exchange reserves jumped by **$8.66 billion** to reach an all-time high of **$725.73 billion** for the week ending February 13. This record-high war chest has allowed the central bank to intervene actively. Traders report that the RBI has been selling dollars in both spot and forward markets to prevent the Rupee from breaching the **91.20** level. Historical data reveals the central bank sold over **$10 billion** in a recent monthly cycle to curb similar volatility. Global Drivers and Trade Impact The strength of the US Dollar Index, which recently climbed toward **98.00**, remains a major headwind. Higher-than-expected US inflation data and a hawkish stance from the Federal Reserve have revitalized the greenback, drawing liquidity away from emerging markets. Geopolitical tensions, particularly in the Middle East and surrounding oil-producing regions, have further soured investor appetite. Rising crude oil prices are a critical concern for India, as they widen the trade deficit, which recently hit a three-month high of **$34.68 billion**. Sectoral Trends Market sentiment is currently split across different sectors. Foreign Portfolio Investors (FPIs) dumped nearly **₹11,000 crore** in Indian IT stocks during the first half of February, fueled by concerns over technological disruptions. However, a recent interim trade deal between India and the United States has provided a silver lining. The removal of certain penal tariffs and a reduction in reciprocal duties to **18%** have encouraged over **$2 billion** in new equity purchases this month, acting as a partial counterweight to the broader sell-off.

Eurozone Bond Yields Stabilize Near Recent Lows Amid ECB Commentary and Geopolitical Developments
**EUROZONE DEBT MARKET BRIEF** Eurozone government bond yields are tracking toward a second consecutive weekly decline this Friday, February 20, 2026. This downward movement reflects a complex interplay between shifting central bank leadership, evolving inflation data, and heightened geopolitical friction in the Middle East. **BOND YIELDS AND FISCAL SUPPLY** The benchmark German 10-year Bund yield is currently hovering around 2.74%, maintaining a retreat from recent highs. Markets are currently absorbing a period of record-high supply, with net issuance of European government bonds expected to reach 930 billion EUR for the full year. Refinancing costs remain a primary concern as roughly 1.4 trillion EUR in gross issuance hits the market. This surge in supply comes as the European Central Bank (ECB) continues its quantitative tightening, reducing its holdings by an estimated 384 billion EUR this year. **CENTRAL BANK TRANSITION** Speculation regarding the future of ECB leadership has introduced fresh uncertainty into the bond market. Reports indicate that President Christine Lagarde may consider an early departure before her term ends in 2027. The potential move is viewed as a strategic opening for French President Emmanuel Macron to influence the selection of a successor before the next domestic election cycle. Despite these rumors, the ECB held rates steady at its most recent February meeting, with inflation cooling to 1.7% in January—falling below the 2.0% medium-term target. **GEOPOLITICAL RISK AND SAFE HAVENS** Tensions between the U.S. and Iran have reignited "risk-off" sentiment, providing further support for government debt. The U.S. administration has issued a 10 to 15-day deadline for a new nuclear deal, warning of significant consequences if negotiations fail. While Brent crude oil has surged past 72.00 USD per barrel on supply disruption fears, the heightened regional instability has driven investors toward the relative safety of European sovereign bonds. This flight-to-quality has effectively capped yield increases that might otherwise have been triggered by the heavy issuance schedule. **ECONOMIC OUTLOOK** The broader Eurozone economy remains in a state of modest expansion, with GDP growing by 0.3% in the final quarter of last year. While services continue to drive growth, the manufacturing sector faces headwinds from global trade volatility and higher energy costs. Market participants are now pricing in a very low probability—roughly 2%—of a rate cut at the ECB’s upcoming March meeting, as policymakers remain cautious about underlying core inflation, which still sits at 2.2%.

**Nikkei Declines Amid Escalating Geopolitical Tensions Between U.S. and Iran**
Market Brief: Nikkei 225 Retraction Japanese equities faced a sharp correction on Friday, February 20, 2026, as the Nikkei 225 index closed at **56,825.70**, marking a decline of **642.13 points** or **1.12%**. The sell-off was triggered by a combination of escalating geopolitical risks and cooling sentiment in the global financial sector. Geopolitical Pressures Heightened tensions between the United States and Iran have become a primary driver of market volatility. Prediction markets currently place the probability of a U.S. military strike on Iran at approximately **60%** by late March. This uncertainty has pushed Brent crude oil prices toward the **$72** per barrel range, creating a dual headwind for Japan. As a major energy importer, the rising cost of fuel threatens corporate margins and consumer spending power. Sector Performance and Drags Sentiment was further dampened by a notable sell-off in U.S. private equity shares. Major listed asset managers have seen increased pressure as high-profile realizations and IPO activity remain uneven, causing a ripple effect across global financial stocks. On the Tokyo Stock Exchange, the downturn was broad-based. The Nikkei Volatility Index climbed **4.23%** to reach **29.07**, reflecting growing investor nervousness. While Mitsui Mining and Smelting gained **5.44%**, heavyweights like Seven & i Holdings fell **4.26%**, and the paper, pulp, and transport sectors faced significant losses. Macroeconomic Context The market is also recalibrating in the wake of recent political shifts and monetary policy expectations. Following the landslide election victory of the Liberal Democratic Party, the new administration is pursuing an expansionary fiscal agenda and a **$135 billion** monetary easing package. However, the Bank of Japan remains in a delicate position. After raising the policy rate to a 30-year high of **0.75%** in December, the central bank is balancing a resilient domestic economy against a weakening yen, which currently trades near **155.17** against the dollar. Key Indicators at a Glance * **Nikkei 225 Close:** 56,825.70 (**-1.12%**) * **Nikkei Volatility Index:** 29.07 (**+4.23%**) * **USD/JPY Exchange Rate:** 155.17 * **Brent Crude:** $71.99 per barrel * **Gold Futures:** $5,038.64 per ounce The current market environment is defined by a "flight to safety," with gold prices rising **0.83%** as investors hedge against Middle Eastern instability and potential supply chain disruptions. Short-term focus remains on the upcoming U.S. inflation data and potential diplomatic developments in the Persian Gulf.