Bearish News
Collection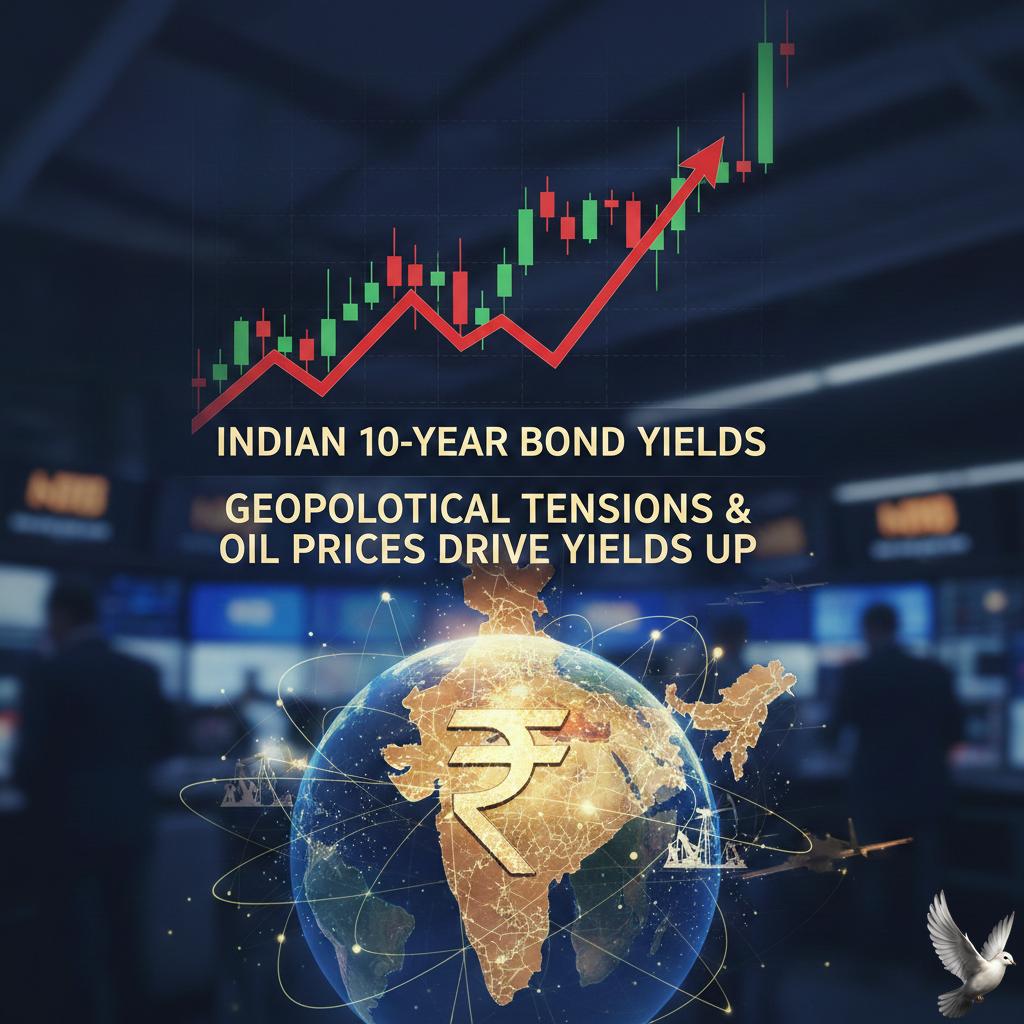
Indian Bond Yields Rise Amid Geopolitical Tensions and Higher Oil Prices
Indian government bond yields moved higher this Friday, driven by a sharp escalation in geopolitical tensions between the U.S. and Iran. The threat of military conflict in the Middle East has pushed Brent crude prices toward a critical resistance level of **$70.30** per barrel, marking a significant shift in market risk appetite. Traders in the Indian debt market remain on edge as the government prepares for its weekly auction of **330 billion rupees** ($3.64 billion). This sale includes three-year, seven-year, and 30-year papers. The increased supply comes at a time when rising energy costs threaten to pressure domestic inflation, which the Reserve Bank of India (RBI) recently projected at **2.1%** for the current fiscal year. The benchmark **10-year bond yield** has edged up to approximately **6.70%**, reversing a recent cooling trend. Earlier this month, yields had softened after the RBI maintained the repo rate at **5.25%** and ensured a banking system liquidity surplus averaging **2.70 trillion rupees**. However, the current "risk-off" sentiment has stalled this rally. In the derivatives market, long-term Overnight Index Swap (OIS) rates have also climbed. The five-year OIS rate settled near **6.04%**, reflecting heightened concern over global supply chain disruptions. Geopolitical uncertainty is now the primary driver, outweighing recent positive news such as the government’s plan to reduce gross borrowing by **1 trillion rupees** through debt switch operations. Global energy markets are reacting to a "10-day ultimatum" issued by the U.S. administration to Iran. With one-third of waterborne crude passing through the Strait of Hormuz, any disruption could see oil prices test **$72.00** per barrel. For India, a major oil importer, these levels increase the fiscal burden and limit the scope for further monetary easing in the near term. Market participants are closely watching the cutoff prices at today's auction for signs of institutional demand. While domestic liquidity remains ample, the external environment is currently dictating the pace of yield movements, forcing a cautious stance across the fixed-income spectrum.
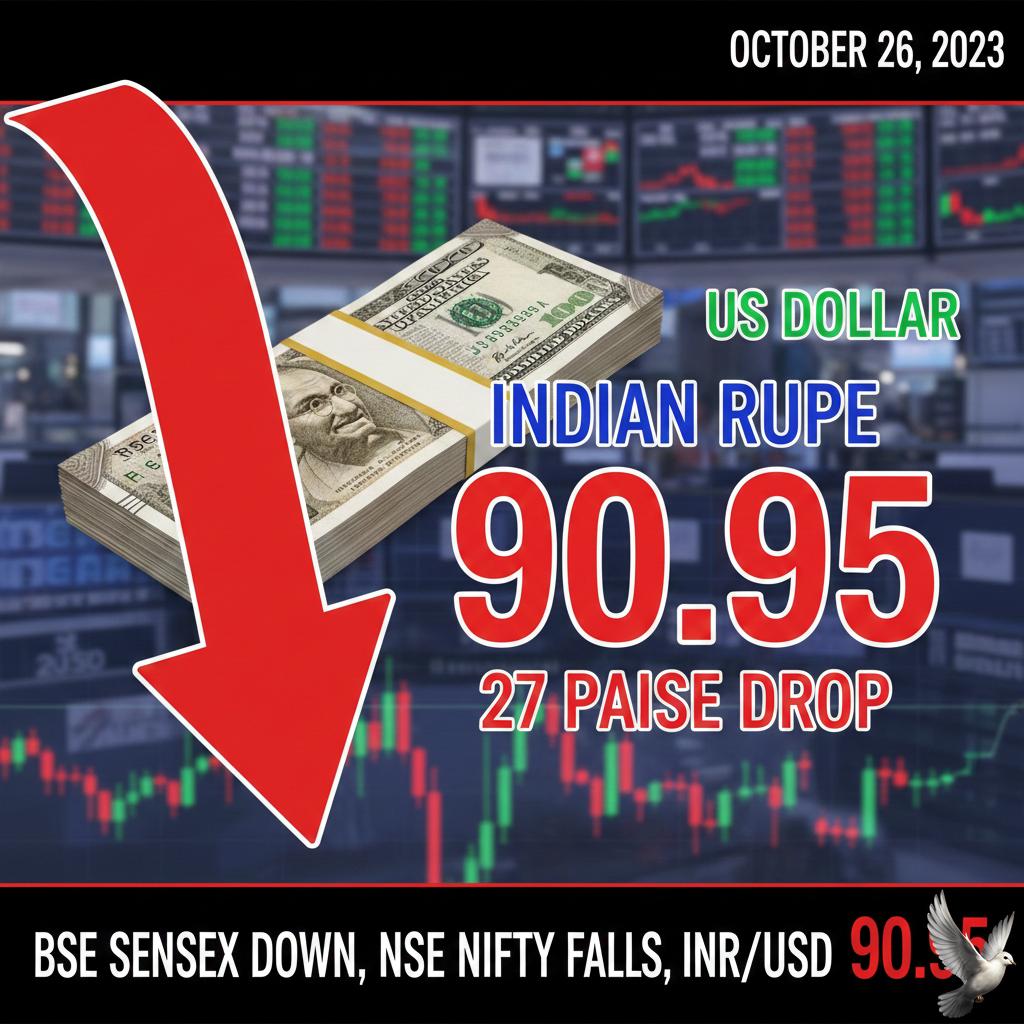
Indian Rupee Drops 27 Paise to 90.95 Against US Dollar
The Indian rupee faced intensified pressure on Friday, February 20, 2026, as a convergence of geopolitical risks and global macro shifts weighed on the domestic currency. The local unit retreated toward the **90.95** level against the US dollar, reflecting a broader trend of risk aversion across emerging markets. The primary catalyst for this weakness is the escalating friction between the United States and Iran. Market nerves were rattled by reports of a potential US military strike following stalled nuclear talks and a strict 15-day ultimatum issued by Washington. This standoff has heightened fears regarding the Strait of Hormuz, a critical maritime corridor that facilitates roughly **20%** of the world's oil supply. Consequently, Brent crude prices surged past the **$71.40** per barrel mark, hitting six-month peaks. For India, which imports nearly **80%** of its oil requirements, this spike directly threatens the trade deficit and stokes concerns of imported inflation. Equity Market Volatility Domestic stock indices reflected the global unease, with the BSE Sensex and NSE Nifty 50 experiencing a significant downturn. The Sensex plummeted by over **1,236 points** (**1.5%**) to settle near **82,500**, while the Nifty 50 shed **365 points** to close around **25,454**. This selloff effectively erased approximately **₹6.4 lakh crore** in investor wealth in a single session. The India VIX, a key measure of market fear, spiked by **10.1%** to reach **13.5**, signaling that traders anticipate continued volatility in the near term. Institutional Flows and Foreign Reserves Capital outflows added to the rupee's woes as foreign portfolio investors (FPIs) turned net sellers. On the most recent trading day, FPIs offloaded equities worth **₹880.49 crore**, while domestic institutional investors (DIIs) also recorded net sales of approximately **₹596.28 crore**. Recent data from the Reserve Bank of India (RBI) further underscores the tightening liquidity environment. India's foreign exchange reserves fell by **$6.71 billion** to **$717.6 billion** as of the latest reporting week. This decline was largely attributed to a dip in foreign currency assets and a sharp **$14.2 billion** drop in gold holdings. The Strengthening Dollar The US dollar index (DXY) continues to find support from a more hawkish Federal Reserve outlook and strong US economic data. The dollar is currently on track for its strongest weekly performance since October, bolstered by its status as a safe-haven asset during times of geopolitical crisis. As the market monitors the developments in West Asia and upcoming US Core PCE data, the rupee is expected to remain under the "cosh," with technical support for the Nifty now pegged at the **25,000** to **25,330** range.
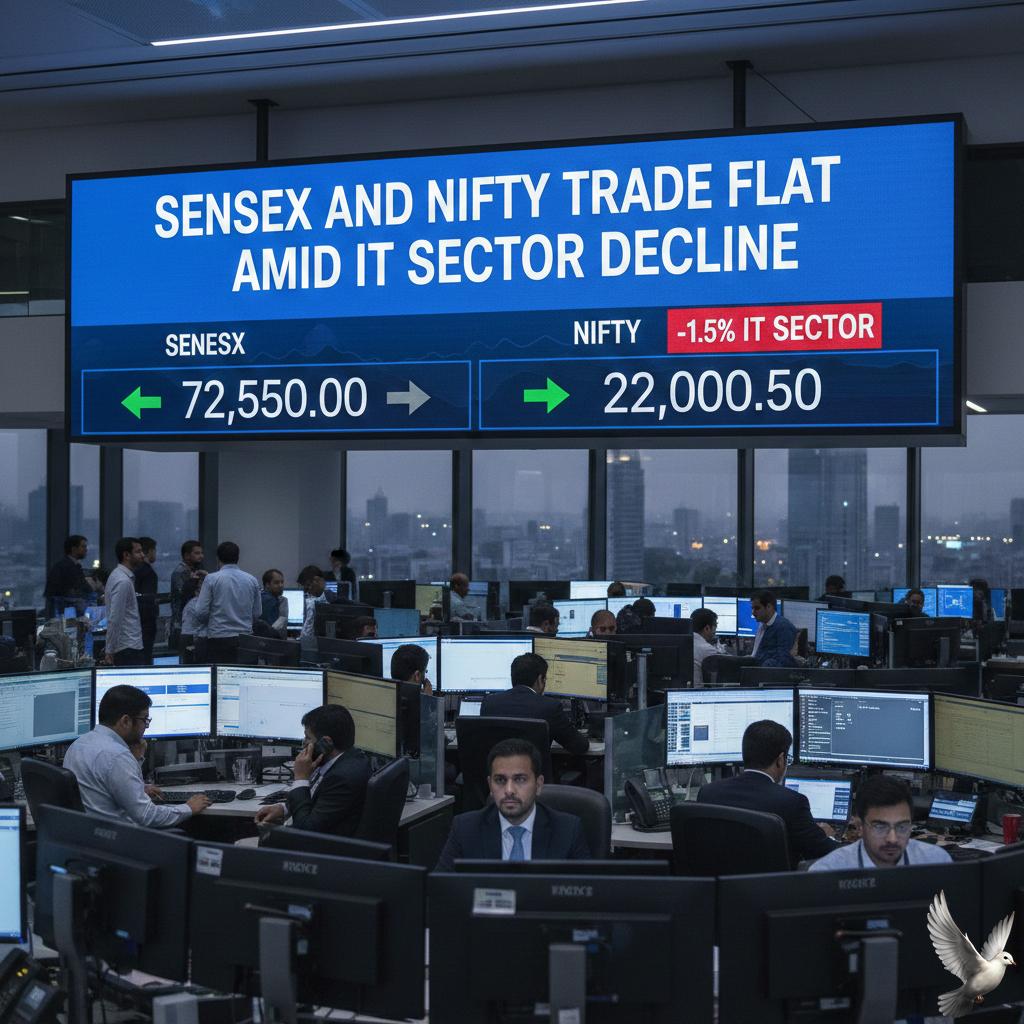
Sensex and Nifty Trade Flat Amid IT Sector Decline
Indian benchmark indices traded with a cautious and muted bias on Friday, February 20, 2026, following a sharp sell-off in the previous session. The market continues to navigate high volatility driven by escalating geopolitical tensions between the U.S. and Iran and concerns over global oil supply chains. The **BSE Sensex** hovered near the **82,500** mark in early trade, showing a marginal decline of approximately **10 to 15 points**. Simultaneously, the **NSE Nifty 50** remained largely flat, trading near **25,470**, struggling to regain momentum after dropping over **360 points** on Thursday. Sectoral performance remained mixed as investors adopted a defensive stance. The **IT sector**, which faced significant pressure earlier in the week, showed signs of stabilization with modest gains in heavyweights like **Infosys** and **TCS**. **Pharma** and **Auto** stocks also saw selective buying interest, providing some support to the frontline indices. In contrast, sectors such as **Realty**, **Media**, and **Consumer Durables** continued to drag the broader market. Banking stocks remained under observation as private-sector lenders faced slight selling pressure, keeping the **Nifty Bank** near the **61,200** level. Top individual gainers included **ONGC**, which rose over **2%** due to firming global crude prices, with Brent crude trading near **$72 per barrel**. **Larsen & Toubro (L&T)** and **Bharat Electronics (BEL)** also traded in the green, supported by steady order book expectations and domestic industrial demand. Market breadth remained weak on the BSE, with approximately **1,826 shares declining** against **1,146 advancing**. The **India VIX**, a key gauge of market anxiety, remains elevated near **13.50**, reflecting a **10% surge** in volatility over the last 24 hours. Institutional activity has contributed to the cautious atmosphere. Provisional data shows **Foreign Portfolio Investors (FPIs)** were net sellers of shares worth **₹880.49 crore** on February 19, while **Domestic Institutional Investors (DIIs)** also offloaded equities worth **₹596.28 crore**. The Indian Rupee remained under pressure, trading near the **₹90 mark** against the U.S. Dollar. Investors are closely monitoring the **Strait of Hormuz** for potential shipping disruptions and the **U.S. Federal Reserve's** upcoming signals on interest rate trajectories, which remain critical for foreign fund inflows.
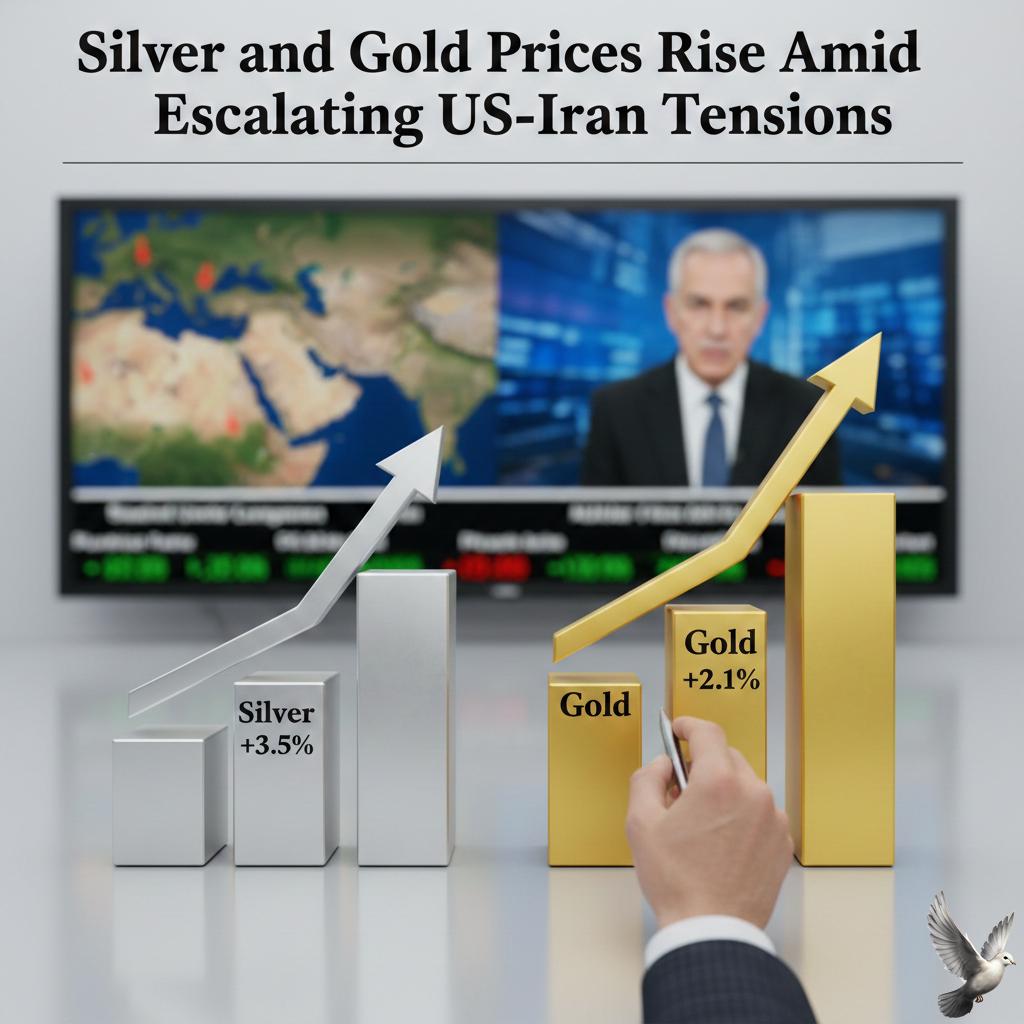
Silver and Gold Prices Rise Amid Escalating US-Iran Tensions
Precious metals are maintaining a firm trajectory as of February 20, 2026, driven by a convergence of heightened geopolitical anxiety and a major structural shift in domestic trading regulations. **Market Performance & Pricing** On the Multi Commodity Exchange (MCX), gold futures for the February 2026 contract are trading strongly higher, holding near **1,56,640** per 10 grams. This recovery follows a recent support floor established near **1,54,000**. Silver is showing even more aggressive recovery signs. After plunging to a weekly low of **2,55,000** per kg on February 18, it has rebounded by more than **15,000**, with MCX futures currently trading modestly higher near **2,70,100** per kg. Despite this bounce, silver remains approximately **34%** below its January all-time high of **4,10,000**. **Geopolitical Drivers** Safe-haven demand has surged due to a "fever pitch" in Middle East tensions. Reports of joint Iranian-Russian military exercises near the Strait of Hormuz, involving special forces and naval drills, have rattled global markets. Simultaneously, the largest U.S. air force deployment since 2003—featuring stealth fighters and aircraft carriers—has intensified fears of a direct confrontation. Global spot gold reflects this unease, hovering around the **5,000** per ounce mark, while international silver trades near **77** per ounce. **Liquidity and Regulatory Shifts** A pivotal change in market mechanics took effect on February 19, 2026. Both the MCX and the National Stock Exchange (NSE) officially withdrew additional margins that were imposed earlier in the month to control volatility. The removal of the **3%** additional margin on gold and the **7%** additional margin on silver is expected to significantly improve market participation. By reducing the upfront capital required to hold positions, exchanges aim to boost liquidity and retail involvement, even as global price swings remain elevated. **Trends and Outlook** The broader market remains caught between two conflicting forces: * **Supportive:** Persistent geopolitical risks and central bank accumulation, with gold now accounting for **17.2%** of India’s foreign exchange reserves. * **Pressure:** Uncertainty regarding the Federal Reserve's rate-cut path and a firm U.S. Dollar index. Technical indicators suggest gold is in a consolidation phase, seeking to reclaim the psychological **5,100** resistance level. Silver's outlook is bolstered by a projected market deficit of **67 million** ounces for 2026, though it faces immediate resistance in the **2,49,000** to **2,54,000** range on the MCX.
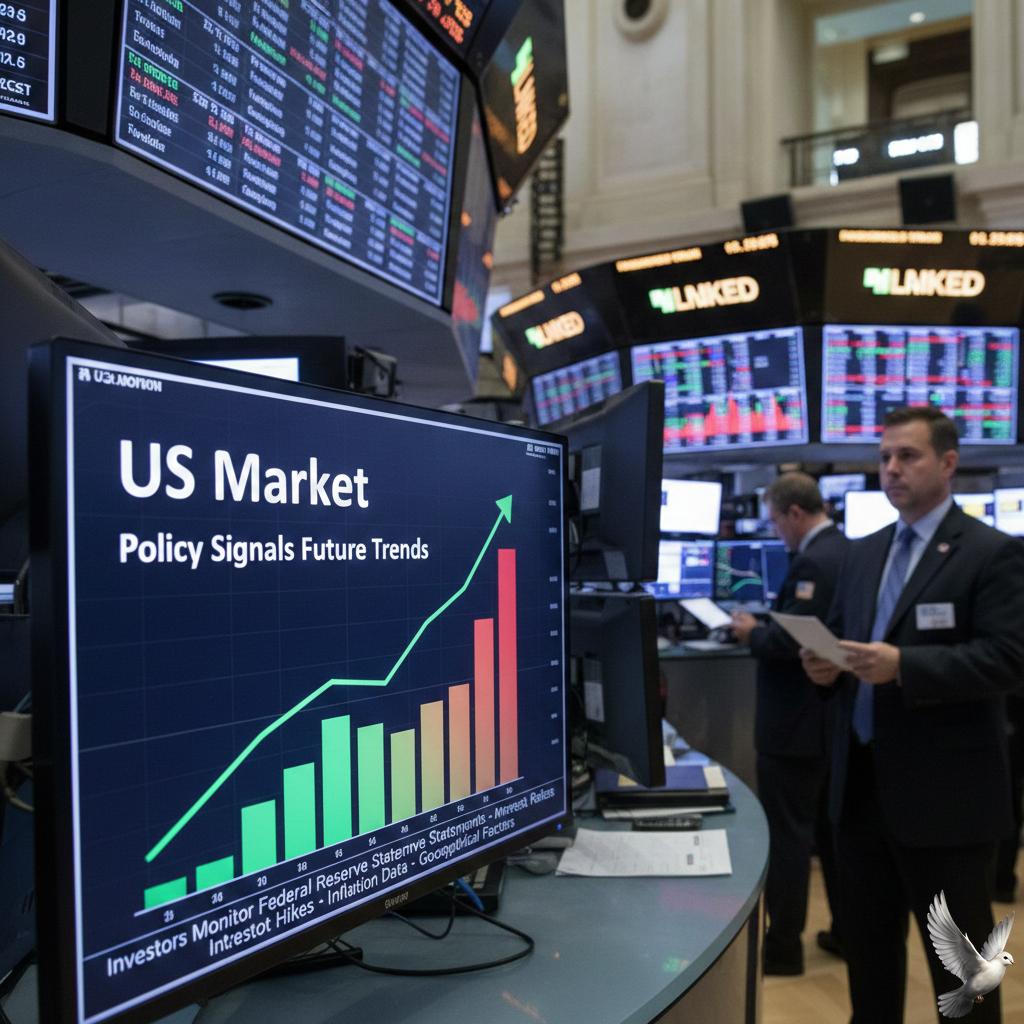
US Market: Investors Monitor Policy Signals for Future Trends
Global markets are positioning for a critical week as the International Monetary Fund prepares to release its annual "Article IV" review of U.S. economic policies on February 25. This assessment comes at a volatile moment for Wall Street, following a year of aggressive fiscal shifts and persistent trade imbalances. Market participants are primarily focused on the IMF’s verdict regarding fiscal sustainability. Recent legislative changes and tax cuts have pushed the projected annual deficit to approximately 5.8% of GDP for 2026, totaling roughly 1.9 trillion dollars. Total public debt is now on a trajectory to reach 101% of GDP this year, with some estimates suggesting it could climb to 120% by 2036. Equity markets have reacted to these headwinds with caution. Recent sessions saw the S&P 500 dip 0.3%, while the Dow Jones Industrial Average fell 0.5% as investors weighed the implications of "fiscal dominance." This phenomenon occurs when massive government borrowing potentially constrains the Federal Reserve's ability to maintain its independence, as rising interest rates significantly increase the cost of servicing the national debt. The U.S. dollar remains a central pillar of the global financial system, though its valuation is under scrutiny. Despite recent volatility, the dollar is currently trading near its 10-year historical average. However, it has depreciated roughly 1.2% year-to-date against a basket of major currencies. Analysts are monitoring whether the IMF will highlight the dollar as overvalued or express concerns over its role in financing the widening 901 billion dollar trade deficit recorded last year. Labor market data also presents a complex picture for the review. The unemployment rate is holding steady at 4.6%, but hire rates have slowed. At the same time, inflation shows signs of cooling, with the headline Consumer Price Index most recently recorded at 2.7%, down from 3.0% in late 2025. Investors are looking for the IMF to provide a definitive roadmap on macro risks, particularly regarding how the U.S. can balance robust growth—projected at 2.4% for 2026—against a debt burden that now exceeds post-World War Two records. The results of this review are expected to influence interest rate expectations and the long-term direction of global capital flows.

Oil Prices Rise Amid U.S. Policy Deadline on Iran
Market Brief: Persian Gulf Escalation Oil markets are entering a period of high volatility as the standoff between the United States and Iran intensifies. On **February 20, 2026**, benchmark prices reached their highest levels in months. Brent crude surged to **$71.93** per barrel, while West Texas Intermediate (WTI) climbed to **$66.74**. The rally follows a breakdown in nuclear negotiations in Geneva. Washington has issued a final **10-day** deadline for Tehran to offer concessions or face military consequences. In response, Iran has moved its national defense systems to a wartime footing and conducted naval drills featuring ballistic missiles near the coast. Strategic Chokepoint Risks The primary driver of the current "war premium" is the threat to the Strait of Hormuz. This narrow waterway facilitates the passage of approximately **21 million** barrels of oil per day, representing roughly **21%** of global consumption. Recent reports of a temporary **2-hour** closure of the Strait by Iranian forces have unnerved traders. Analysts suggest that a significant blockage could trigger a supply shock, potentially driving prices toward the **$100** mark. Currently, markets have priced in a risk premium of **$5** to **$10** per barrel based on the immediate threat level. Military and Economic Indicators The U.S. has significantly bolstered its regional presence, deploying the **USS Abraham Lincoln** carrier strike group and over **50** advanced combat jets, including F-35s and F-22s. Reports indicate that the **USS Gerald R. Ford** is also en route to the region. Simultaneously, U.S. domestic energy data shows a tightening market. Crude and gasoline inventories fell unexpectedly for the week ending **February 13**, defying analyst predictions of a **2.1 million** barrel increase. This domestic drawdown, combined with geopolitical fears, has created a dual-pressure environment for prices. Supply and Demand Outlook Despite the immediate price spikes, the International Energy Agency (IEA) notes that global oil supply actually rose by **2.4 million** barrels per day in early **2026**, split between OPEC+ and non-OPEC producers like Guyana. However, Iranian exports have already begun to contract, falling to **1.39 million** barrels per day in January—a **26%** year-over-year decline. If diplomatic efforts fail to produce a resolution by the end of February, market volatility is expected to expand by another **15%** to **25%** as hedging activity intensifies across the energy sector.

Asian Stocks Decline and Oil Prices Rise Amid Middle East Geopolitical Focus
**Geopolitical Risk Brief: US-Iran Escalation** Asian equities faced a widespread downturn as escalating tensions between the United States and Iran soured investor sentiment. Japan's **Nikkei 225** and Australia's **S&P/ASX 200** both opened lower as the market grappled with fresh security risks in the Middle East. Energy markets are currently reflecting a significant "war premium." **Brent crude** surged past **$71.80** per barrel, marking its highest level since August. Simultaneously, **West Texas Intermediate (WTI)** climbed above **$66.50**. Traders are pricing in a **70% probability** of a US military strike following the collapse of nuclear discussions in Geneva. The strategic importance of the **Strait of Hormuz** remains the primary concern for global supply. Roughly **20%** of the world's daily oil consumption passes through this chokepoint. Any disruption to shipping lanes could trigger a rapid spike in energy costs and disrupt global manufacturing supply chains. Safe-haven assets have seen a corresponding spike in demand. Spot **gold** has breached the symbolic **$5,000** per ounce mark, as investors move away from riskier equity positions. This flight to safety is also strengthening the **US Dollar**, which rose **0.25%** against a basket of major currencies. Market analysts suggest that stocks have not yet fully priced in the potential for a prolonged conflict. While many investors originally expected a diplomatic resolution, recent military movements—including the deployment of **carrier strike groups** and stealth fighters—have shifted expectations toward a short-term military intervention. Central banks are monitoring the situation closely. A sustained rise in oil prices threatens to reignite **inflationary pressures**, potentially delaying planned interest rate cuts in major economies. For now, volatility remains high as the global market awaits a definitive signal from Washington or Tehran.

Indian Stock Market Declines as Rising US-Iran Tensions Lift Oil Prices
Market Brief: India’s Response to Rising Geopolitical Stress Indian equity markets faced a wave of heavy selling as the week drew to a close. The benchmark **BSE Sensex plummeted 1,236 points**, representing a **1.48% decline**, to settle at **82,498.14**. Simultaneously, the **NSE Nifty 50** shed **1.41%**, sliding below the psychological support level of 25,500 to end the session at **25,454.35**. The downturn was triggered by a sudden escalation in military rhetoric between the United States and Iran. Market nerves were rattled by reports of a possible military strike and the deployment of aircraft carriers to the Persian Gulf. Energy and Commodity Pressure The geopolitical standoff had an immediate impact on the energy sector. **Brent crude oil** futures climbed nearly **2%**, trading at **$71.66 per barrel**. This marks its highest level in six months. US West Texas Intermediate (WTI) followed suit, settling at **$66.43**. Analysts warn that a total disruption of Iranian exports or any interference with the **Strait of Hormuz**—where **20% of global oil** passes—could push prices toward **$100**. As a major net importer of oil, India is particularly sensitive to these shifts. Higher crude prices translate directly into concerns over widening trade deficits and increased domestic inflation. Currency and Volatility The **Indian Rupee (INR)** faced downward pressure as the US Dollar strengthened on safe-haven demand. The exchange rate moved toward **91.04 against the USD**, reflecting the broader exit from emerging market assets. Market volatility spiked significantly during the session. The **India VIX surged over 10%** to reach **13.46**, indicating heightened investor anxiety and expectations of further short-term turbulence. Nearly every sector ended the day in the red. Banking, metal, and auto stocks were among the hardest hit, with the **Nifty Bank** index dropping **1.32%** to close at **60,739.55**. Outlook and Investor Sentiment Despite the sharp one-day crash, some resilience was noted earlier in the week due to consistent domestic institutional inflows. However, the current environment is dominated by a "sell-on-rallies" sentiment. Investors are now closely monitoring the **10-day deadline** mentioned by US leadership regarding nuclear negotiations. Further escalation in the Middle East is expected to keep the **war premium** on oil high, maintaining pressure on Indian fiscal stability and corporate margins.

Brent crude reaches six-month high amid discussions of potential geopolitical risk premium
Brent crude prices have reclaimed the **$70** threshold, currently trading near **$70.52** per barrel as of February 19, 2026. This surge marks a significant shift in market sentiment, driven by a "war premium" that has seen prices jump over **4%** in recent sessions. The primary catalyst is the intensifying friction between the U.S. and Iran. While diplomatic talks continue in Geneva, markets are on edge following reports of a potential U.S. military buildup in the Middle East. Strategic analysts have raised the probability of a substantial supply disruption to **30%**, citing risks of a conflict that could last for weeks rather than days. A major focus remains the Strait of Hormuz, a critical chokepoint through which roughly **20%** of the world’s daily oil consumption passes. Iran’s recent military drills in the area and U.S. maritime advisories for ships to avoid Iranian waters have heightened fears of a closure. Any sustained blockage would severely impact global flows, particularly to Asian markets. This geopolitical volatility is currently outweighing structural oversupply concerns. Global inventories grew by **477 million barrels** in 2025, and the International Energy Agency (IEA) still forecasts a supply increase of **2.4 million barrels per day** for 2026. Despite this looming surplus, the immediate threat to Middle Eastern production is keeping a firm floor under prices. OPEC+ is also playing a decisive role. Eight key member nations have paused production increases through the first quarter of 2026 to manage the emerging global glut. However, signals suggest the group may resume output hikes starting in April to meet peak summer demand, which could introduce new downward pressure if tensions ease. In the West, the Russia-Ukraine conflict continues to add a layer of underlying risk. While talks are ongoing, approximately **140 million barrels** of Russian crude remain at sea, and recent drone strikes on Black Sea infrastructure have kept traders cautious about regional stability. Market participants are now watching for a decisive break above resistance levels. While some agencies like the EIA project an average price of **$58** for the full year 2026, the current geopolitical climate suggests that as long as the threat of a strike looms, Brent is likely to maintain its premium above the **$70** mark.

US Single-Family Housing Starts and Building Permits: January Data
U.S. Housing Construction Brief U.S. single-family homebuilding activity saw a notable rebound at the close of last year. Housing starts for single-family units rose **4.1%** in December to a seasonally adjusted annual rate of **981,000** units. This growth followed a strong November, marking a recovery from earlier autumn lows. Total housing starts, including multifamily projects, jumped **6.2%** in December to an annual rate of **1.404 million**. This exceeded market expectations of **1.33 million**, driven largely by an **11.3%** surge in the multifamily sector. Despite this late-year rally, total starts for the full year 2025 remained **0.6%** lower than the previous year. Leading Indicators and Future Outlook While construction activity increased, forward-looking data suggests a cautious outlook. Building permits for single-family homes—a key indicator of future supply—slipped **1.7%** in December to a rate of **881,000** units. Total permits across all sectors rose **4.3%** to **1.448 million**, but this was primarily fueled by a **15.2%** spike in apartment and condo authorizations. The persistent decline in single-family permits indicates that builders remain hesitant to break new ground on individual homes heading into the spring season. Builder Sentiment and Market Pressures Homebuilder confidence has hit its lowest level in five months. The NAHB/Wells Fargo Housing Market Index dropped to **36** in February 2026, missing the forecast of **38**. Sentiment is weighed down by high material costs, labor shortages, and a significant drop in prospective buyer traffic. Builders are increasingly turning to incentives to move inventory. Approximately **36%** of builders reported cutting prices in February, while **65%** utilized sales incentives such as mortgage rate buydowns. Financing and Affordability Constraints Mortgage rates continue to act as a primary barrier to market expansion. The 30-year fixed mortgage rate is currently hovering around **6.1%**. While this is an improvement from the **6.86%** seen a year ago, it remains high enough to keep many potential buyers on the sidelines. Affordability is further strained by rising construction expenses. Tariffs on imported materials like lumber and cabinetry, combined with a shortage of approximately **300,000** workers in the construction sector, have kept new home prices elevated. The median new home price has seen downward pressure from builder discounts, yet the "lock-in effect" persists. With **80%** of current mortgage holders locked into rates below **6%**, existing inventory remains tight, forcing the market to rely heavily on new construction that is increasingly expensive to deliver.

Japan 20-Year Bond Auction Sees Steady Demand in First Post-Election Sale
The Japanese government bond (JGB) market has entered a period of relative stabilization following a month of historic volatility. As of mid-February 2026, the 20-year JGB yield is hovering near **2.97%**, pulling back from an almost three-decade peak of **3.46%** reached in late January. This cooling follows a period of intense selling triggered by Prime Minister Sanae Takaichi’s pledge to suspend the **8%** consumption tax on food for two years. While the initial announcement sparked fears of deficit-financed spending, the ruling coalition's landslide election victory on February 8 has provided the political mandate necessary to pursue a more "responsible" stimulus package. Market participants have taken comfort in recent government communications suggesting the tax cuts will be funded without significantly increasing the issuance of deficit-financing bonds. This shift in tone has eased the "mini-Takaichi shock" that saw 40-year yields briefly breach the **4.0%** threshold last month. A recent auction of 20-year bonds showed stable, albeit moderate, demand. While the bid-to-cover ratio remains below historical averages, the presence of foreign investors and domestic life insurers has prevented a further spike in yields. Foreign demand is particularly focused on hedged bonds, which now offer more attractive returns compared to earlier in the year. The Ministry of Finance is also supporting the super-long end of the curve by reducing issuance volumes. The plan for fiscal year 2026 includes a reduction in super-long bond issuance by approximately **100 billion yen** per month, a move designed to address the structural demand gap in the **20- to 40-year** sector. Monetary policy remains a secondary but critical factor. The Bank of Japan maintains its policy rate at **0.75%**, with market expectations leaning toward a potential hike to **1.0%** or **1.25%** by late 2026. Governor Kazuo Ueda has reassured markets that fiscal policy will not obstruct the bank's path toward normalization. The 10-year yield is currently trading near a six-week low of **2.14%**, reflecting a broader trend of "unclenching" across the JGB curve. Despite this calm, a "duration gap" persists among domestic insurers, who remain cautious as they wait for higher entry points, suggesting that while the immediate crisis has passed, the long-term yield floor has moved significantly higher than in previous years.

Ola Electric Shares Rise 5% Following Four-Session Decline
Ola Electric Mobility shares experienced a notable shift in momentum following a legal reprieve for its leadership. The Bombay High Court at Goa has stayed an arrest warrant issued against CEO Bhavish Aggarwal by a consumer disputes commission. This judicial intervention halted a four-session losing streak, providing a temporary floor for a stock that has faced intense selling pressure. Despite the legal breather, the company’s market performance remains under significant duress. The stock recently touched an all-time low of **₹27.36** on the BSE, representing an **82%** collapse from its peak of **₹157.40** reached in August 2024. Market capitalization has eroded to approximately **₹12,716 crore** as the scrip continues to trade well below its IPO price of **₹76**. Financial results for the quarter ended December 2025 highlight a period of aggressive "structural reset." While net loss narrowed to **₹487 crore** from **₹564 crore** in the previous year, revenue from operations plummeted by **55%** to **₹470 crore**. This sharp decline is attributed to a massive drop in deliveries, which fell to **32,680 units** compared to over **84,000 units** in the same period last year. The company is currently executing a lean operating model to lower its break-even point. Recent strategic moves include reducing the retail store count from over **4,000** to approximately **700** and slashing quarterly operating expenditure to **₹484 crore**. Management aims to further reduce this spend to a steady state of **₹250–300 crore**, which would lower the EBITDA break-even threshold to roughly **15,000 units** per month. Market dynamics show Ola Electric losing ground to both legacy manufacturers and agile competitors. In the two-wheeler segment, the company has slipped to the fifth position in recent rankings, with players like Ampere and legacy giants TVS and Bajaj gaining traction. Analysts have flagged persistent headwinds, including sluggish EV penetration growth and service-related challenges that have impacted brand perception. Brokers have responded with caution, with some slashing target prices to as low as **₹20** and **₹27**, citing concerns over negative cash flows and rising net debt. However, the company maintains that its vertical integration strategy and the upcoming completion of its Gigafactory by March 2026 will provide a long-term cost advantage as the industry stabilizes.
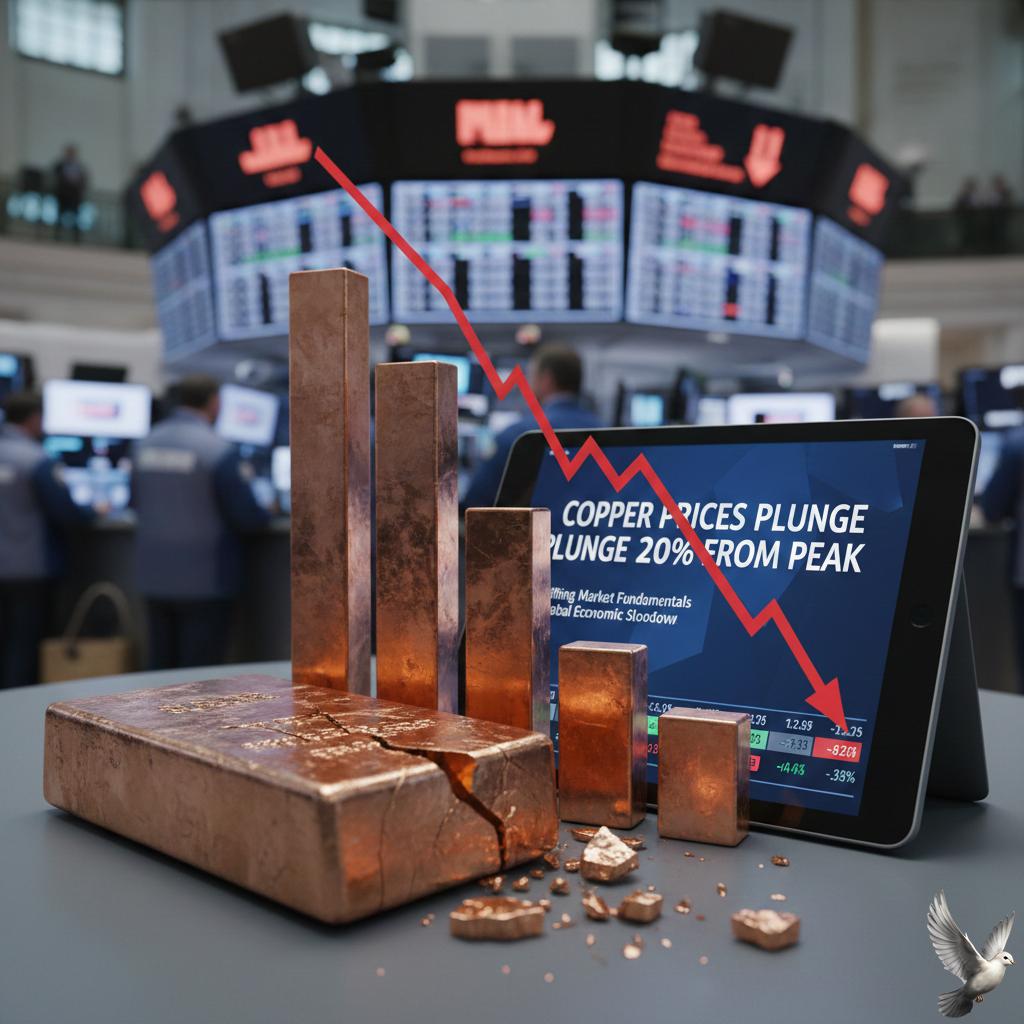
Copper prices decline 20% from peak amid shifting market fundamentals
Copper prices have entered a sharp consolidation phase in February 2026, retreating from record highs established just weeks ago. In global markets, the metal fell to approximately **$5.75 per pound**, a significant drop from the January peak of over **$6.50 per pound**. This **15%** decline is largely attributed to the Lunar New Year holiday in China, which has halted activity in the world’s largest copper-consuming nation. Trading volumes have thinned as major Chinese manufacturing hubs extended shutdowns, some of which began as early as late January and are expected to last through late February. On the London Metal Exchange (LME), copper futures recently slipped to **$12,780 per tonne**, while domestic prices on India’s Multi Commodity Exchange (MCX) reached intraday lows of **₹1,179 per kg**. Analysts note that this cooling period is intensified by a surge in global exchange inventories, which have climbed toward a 21-year high of over **970,000 tons**. Despite the current price volatility, the long-term outlook remains underpinned by severe structural supply constraints. The transition to renewable energy, the expansion of AI data centers, and massive power grid modernization programs are projected to drive global demand to **28 million tonnes** this year. Market participants are closely monitoring the **$6.00 per pound** level as a critical psychological and technical threshold. While short-term selling pressure persists, many traders view this as a necessary correction rather than a reversal of the multi-year bullish trend. Stabilization is expected to depend on the resumption of Chinese industrial activity in March. Early indicators suggest that Chinese buyers may return aggressively if prices hold below key resistance levels, seeking to replenish depleted stockpiles for the spring construction season.

Bitcoin and Ethereum Prices Ease Following Weekend Gains
**Crypto Market Brief: February 17, 2026** **Bitcoin Consolidates Below Key Resistance** Bitcoin continues to trade in a tight range, currently hovering near **$68,355** after a failed attempt to reclaim the psychological **$70,000** level. The asset is undergoing what analysts describe as "orderly deleveraging," with futures open interest dropping significantly. Despite the pullback, Bitcoin holds above critical moving averages, though year-to-date performance signals one of the weakest first quarters since **2018**. **Altcoin Mixed Performance** Ethereum has dipped below the **$2,000** mark, trading around **$1,985** amid net ETF outflows and cooling institutional demand. In contrast, select major altcoins are decoupling with gains. XRP has surged to approximately **$1.47**, and BNB is trading firmly around **$628**. However, the meme coin sector remains under pressure, with Dogecoin sliding to **$0.10**. **Market Sentiment & Key Drivers** The total cryptocurrency market capitalization stands at **$2.35 trillion**, reflecting a consolidation phase rather than a structural breakdown. **Latest Developments** * **ETF Expansion:** Trump-linked *Truth Social* has reportedly filed for new ETFs tracking Bitcoin, Ethereum, and Cronos, potentially injecting new political and institutional narratives into the market. * **Macro Headwinds:** With U.S. inflation sticking at **2.4%** and Federal Reserve rates holding near **3.75%**, risk assets face continued pressure from a "higher for longer" monetary stance. * **Institutional Flows:** While retail speculation has cooled, institutional activity is shifting toward regulated products, though recent days have seen mixed flows for spot Bitcoin and Ethereum ETFs. Traders remain cautious, awaiting the next major catalyst—likely from upcoming Federal Reserve minutes or regulatory shifts—to break the current indecision.

Ola Electric Hits All-Time Low After Citi Cuts Price Target by 51%
Shares of Ola Electric Mobility plunged to a new all-time low of **₹27.36** on February 17, 2026, marking a significant collapse from its August 2024 peak of **₹157.40**. The stock has shed nearly **19%** of its value in the last month alone, with its market capitalization shrinking to approximately **₹12,315 crore**. This downward spiral follows a severe downgrade from Citigroup, which shifted its rating to **Sell** and slashed the price target by **51%** to **₹27**. The brokerage cited a "structural reset" in the business, highlighting deeper concerns over slowing electric vehicle (EV) penetration and a narrowing price gap between electric and traditional fuel engines. Market share erosion has become a critical pressure point. Once holding a dominant **35%** share in 2024, Ola Electric saw its market presence more than halve to **15.57%** by the end of 2025. Recent data from early 2026 indicates the share has further slipped toward the **6%** mark as legacy manufacturers like TVS Motor and Bajaj Auto aggressively reclaim the top spots. Financial results for the December quarter (Q3 FY26) underscore the operational strain. Revenue from operations crashed **55%** year-on-year to **₹470 crore**, down from **₹1,045 crore** in the same period last year. This revenue slump was driven by a sharp drop in sales volume, with quarterly registrations falling to **32,680 units** compared to over **84,000 units** a year ago. Despite the shrinking top line, the company reported a narrowed consolidated net loss of **₹487 crore**, an improvement from the **₹564 crore** loss recorded in the previous year. Management points to improving gross margins, which reached **34.3%** this quarter, as a sign of vertical integration through its new battery cell technology and leaner operating structures. Concerns remain regarding liquidity and long-term viability. Analysts have flagged persistent negative free cash flows and a high dependence on rapid scaling to reach a break-even point. While the company is betting on its Gigafactory completion by March 2026 to stabilize unit economics, the broader market remains cautious due to ongoing service-related complaints and heightening competition from both startups and established giants. Investor sentiment is further tested by a cooling adoption rate in the two-wheeler segment. Regulatory shifts and tax adjustments have improved the affordability of internal combustion engine vehicles, making the transition to electric slower than early industry forecasts suggested. The stock currently trades nearly **64%** below its initial public offering price of **₹76**.
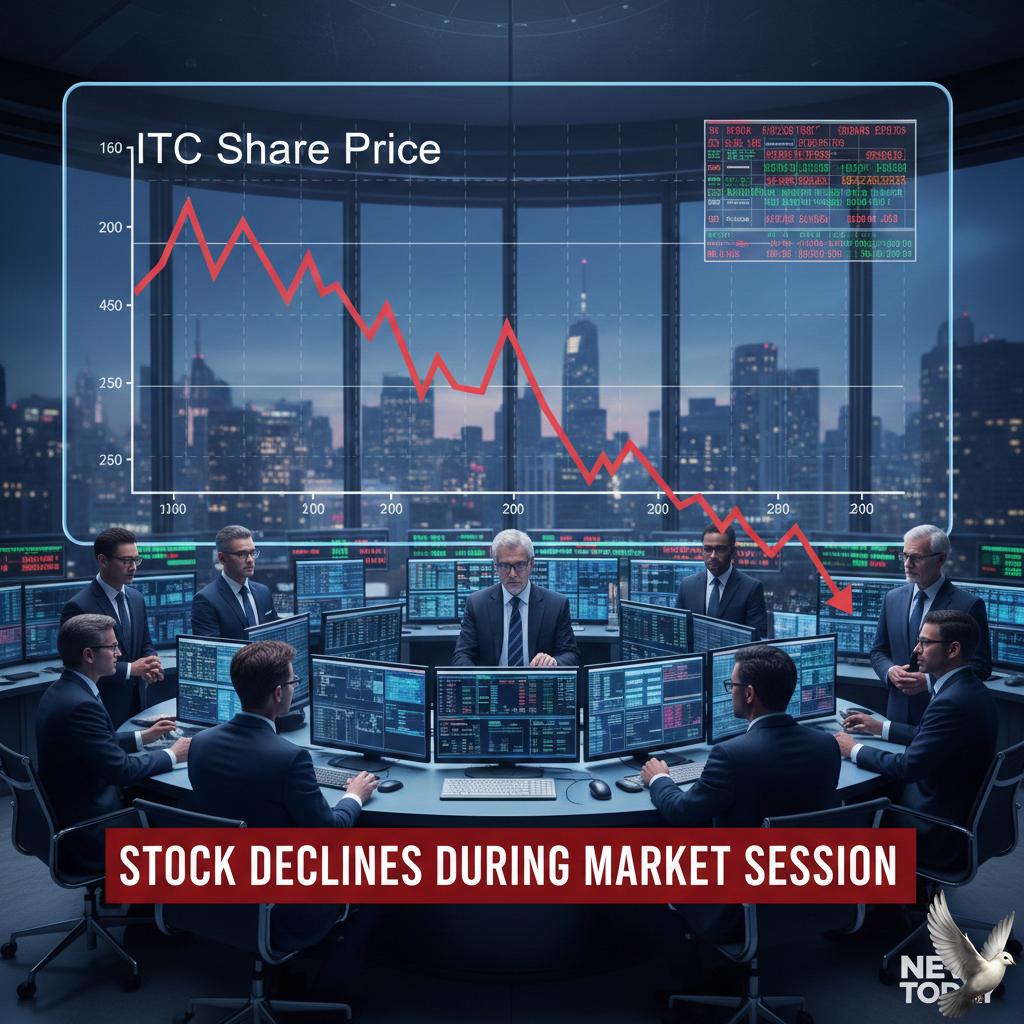
ITC Share Price Performance: Stock Declines during Market Session
Global Market Brief: February 2026 The global economy enters mid-February 2026 showing a projected growth rate of **3.3%**. Despite this resilience, a "divergence" theme is taking hold. While the U.S. labor market remains stable with unemployment falling to **4.4%**, trade policy shifts and uneven tariffs are beginning to reshape export competitiveness globally. Monetary Policy and Interest Rates The U.S. Federal Reserve has adopted a hawkish pause to start the year. The target interest rate range remains at **3.50% to 3.75%** following three consecutive cuts in late 2025. Recent Consumer Price Index (CPI) data shows year-over-year inflation at **2.7%**. While this is an improvement, it remains above the Fed's **2%** target. Markets currently price in low odds for a cut in March, with most analysts expecting only one to two additional reductions totaling **50 basis points** by the end of 2026. Equity Market Performance U.S. equity-index futures are showing signs of risk aversion. S&P 500 futures fell **0.3%** and Nasdaq 100 futures slipped **0.6%** ahead of the Tuesday session. This follows a period of volatility where investors have begun rotating capital away from software companies at risk of AI-driven "cannibalization." In contrast, semiconductor hardware remains a primary growth engine. The global chip market is projected to reach **$975 billion** in 2026, a **25%** year-on-year increase. High-performance logic and memory chips are leading this surge, with some hardware giants reporting record gross margins near **49.1%**. Energy and Commodities Energy markets are currently dominated by a supply-demand imbalance. Brent crude futures are trading near **$67.75** per barrel, while West Texas Intermediate (WTI) sits around **$62.89**. Analysts expect oil prices to decline toward an average of **$58** per barrel for the full year 2026 as global production from non-OPEC+ sources—specifically Brazil, Guyana, and Argentina—outpaces demand growth. However, a geopolitical risk premium of **$5 to $7** remains embedded in prices due to tensions in the Persian Gulf. Gold has seen a recent pullback after a sharp rally. Comex gold futures are trading at approximately **$5,021.99** per ounce. The metal is caught between a firmer U.S. dollar, which exerts downward pressure, and continued geopolitical uncertainty, which provides a floor for prices. Key Economic Indicators * Global Projected GDP Growth: **3.3%** * U.S. Federal Funds Rate: **3.50% - 3.75%** * U.S. Unemployment Rate: **4.4%** * S&P 500 Index Level: **~6,836** * Spot Gold: **~$5,021/oz** * Brent Crude: **~$68/bbl** Trade dynamics are notably shifting. New tariff structures have made certain imports, like South African wine, **17%** more expensive relative to 2024, while others, such as Italian rice, have become **12%** cheaper. This uneven trade landscape is forcing a massive reallocation of market shares across global value chains.

HCL Tech Share Price: Monthly Performance Analysis
Lithium Market Intelligence: February 2026 Update The global lithium market has entered a period of sharp recalibration. After a blistering January that saw prices for battery-grade material jump nearly **46%**, the first half of February 2026 is witnessing a strategic consolidation. Lithium carbonate prices in the U.S. and Asian markets have eased by approximately **1.5%** as procurement teams pause to assess the rapid gains of the previous month. Market dynamics are currently defined by "front-loading" behavior. Manufacturers are aggressively securing inventory ahead of major policy shifts, specifically the reduction of VAT export rebates in China effective April 2026. This has created a surge in spot demand, driving lithium carbonate to trade in a core range between **$18,000** and **$25,000** per metric ton, while lithium hydroxide maintains a premium at **$20,000** to **$28,000**. Demand Transformation A structural shift in demand is now evident. While electric vehicles remain the largest consumer, accounting for roughly **75%** of the battery market, utility-scale Battery Energy Storage Systems (BESS) have emerged as the fastest-growing sector. Global BESS shipments are projected to grow by over **50%** this year, providing a new "price floor" that prevents the market from returning to the lows of 2024. Supply and Production Outlook Global output is expected to exceed **1 million** metric tons in 2026, yet the market remains in a "tight balance." Major producers are exercising capital discipline; for instance, Albemarle recently reported **$1.4 billion** in quarterly sales but has prioritized productivity over expensive new expansions. The geographic landscape is also shifting. While Australia and Chile remain dominant, the U.S. is rapidly scaling its domestic footprint, targeting **15%** of global supply by the end of this year—a significant leap from just **1%** in 2020. Major oil players have also pivoted, with companies like ExxonMobil and Chevron accelerating brine extraction projects in the Smackover Formation. Forecast and Risk Analysts at major institutions, including Morgan Stanley and UBS, are forecasting a market deficit ranging from **22,000** to **80,000** metric tons for the full year 2026. This anticipated shortage is likely to drive a secondary price rally in the second half of the year. Volatility remains a key risk factor. Regulatory uncertainties in China and potential trade policy changes in the U.S. continue to weigh on sentiment. Investors and OEMs are increasingly moving toward multi-year pricing frameworks to hedge against these fluctuations as lithium transitions from a speculative commodity to a critical strategic asset.
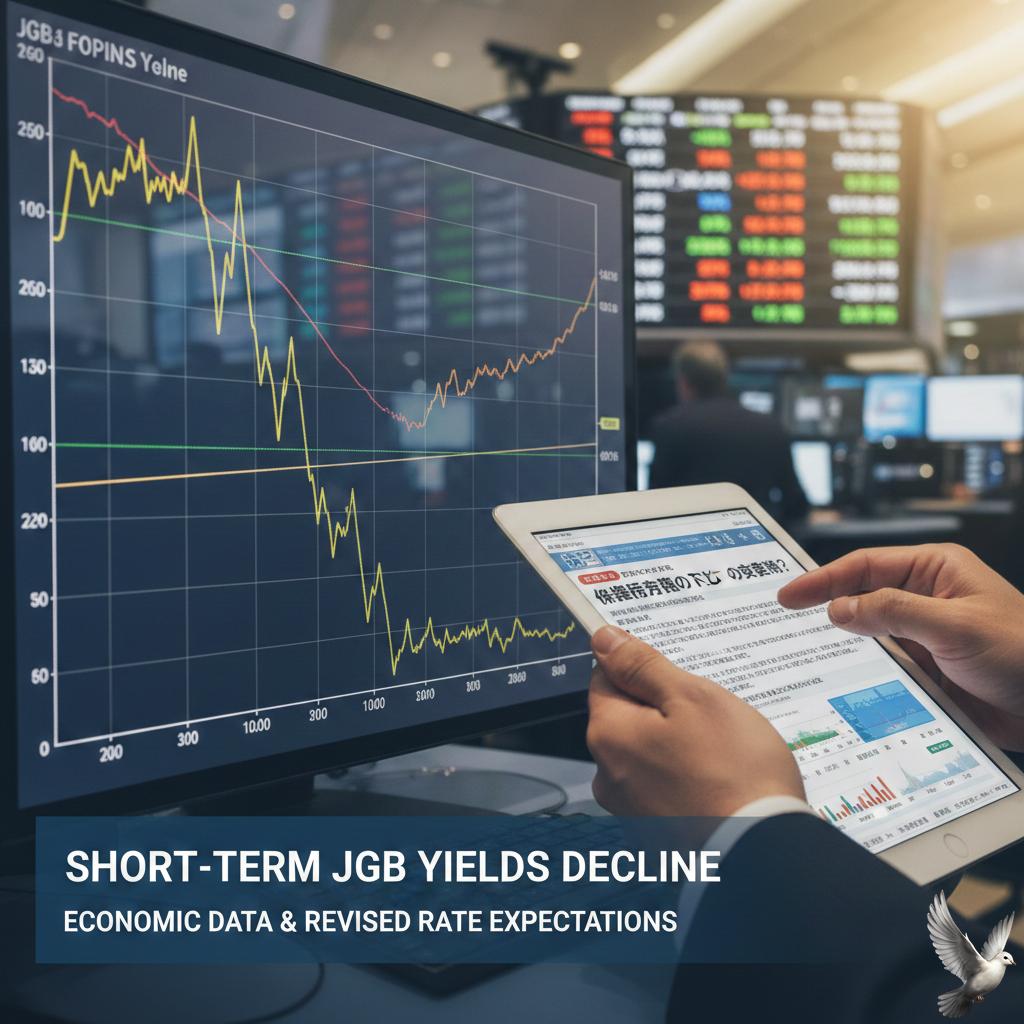
Short-Term JGB Yields Decline Following Economic Data and Revised Rate Expectations
Japanese government bond (JGB) yields edged lower on Monday, February 16, 2026, as investors reacted to underwhelming fourth-quarter growth data. The preliminary Gross Domestic Product (GDP) report showed the economy expanded at an annualized rate of only 0.2 percent. This figure fell significantly short of the 1.48 percent growth forecast by market analysts. While the result marks a return to growth after two consecutive quarters of contraction, the marginal pace suggests a fragile recovery rather than a robust rebound. The weak GDP print has immediate implications for monetary policy. Short-term bond yields declined as traders scaled back expectations for an aggressive interest rate hike in the second quarter. The Bank of Japan (BoJ) currently maintains its policy rate at 0.75 percent, a 30-year high following the December 2025 increase. Market participants are now reassessing the likelihood of an April hike. Many analysts believe the central bank may wait until June or July to act, pending more definitive results from the 2026 spring wage negotiations. Consumer spending, which makes up over half of the Japanese economy, grew by a slim 0.1 percent. This persistent weakness in private consumption continues to complicate the central bank's goal of achieving sustainable 2 percent inflation. External pressures are also weighing on the outlook. Exports fell by 0.3 percent in the final quarter of 2025. This decline was partially attributed to the impact of U.S. tariffs on automobile shipments and a notable drop in tourism arrivals. In the currency markets, the Japanese yen weakened following the data release, trading near the 153.25 level against the U.S. dollar. The currency remains volatile as it balances local economic misses against the narrowing interest rate differential with the United States. Fixed-income investors are closely monitoring the 10-year JGB yield, which has faced upward pressure from fiscal concerns under the administration of Prime Minister Sanae Takaichi. Despite the current dip in short-term yields, long-term projections suggest the 10-year yield could reach 2.3 percent by the end of 2026 if fiscal expansion continues. The upcoming January trade data and spring labor-management talks will serve as the next critical catalysts for the bond market. For now, the soft GDP figures have provided a temporary reprieve for short-term yields, forcing a more cautious "wait-and-see" approach from the BoJ.

Crude Oil Prices Stabilize Before US-Iran Nuclear Negotiations
Crude oil prices have maintained a steady position as of Monday, February 16, 2026. This stability follows a period of volatility where benchmarks recorded their first consecutive weekly declines of the year. Market participants are currently balancing persistent geopolitical friction against a projected global supply surplus. **Benchmark Performance** West Texas Intermediate (WTI) is currently trading near **$62.85** per barrel. This marks a significant consolidation after falling from the **$65** level seen earlier in the month. Brent crude is hovering around **$67.70** per barrel. While prices touched highs near **$70** in January due to supply concerns, they have since moderated as immediate fears of military escalation eased. **Geopolitical Landscape** Washington and Tehran are entering a critical phase of diplomatic engagement. Indirect talks in Oman have signaled a preference for a negotiated settlement over military action, which has stripped some of the "war premium" from current pricing. Despite the focus on diplomacy, the regional environment remains tense. The United States has recently deployed a second aircraft carrier to the Middle East, maintaining a visible military presence. Analysts suggest that a sustained break above **$66** for WTI would require a fresh escalation, while continued de-escalation could see prices retreat toward the **$60** mark. **OPEC+ Strategy** The OPEC+ alliance is actively debating a production increase scheduled for April. Key members, including Saudi Arabia and the UAE, are looking to recover market share and accommodate anticipated summer demand. A formal decision is expected at the upcoming meeting on March 1. Some members argue that current fears of oversupply are exaggerated, while others remain cautious due to a massive global inventory build. Reports indicate that global stocks grew by **477 million** barrels in 2025—the fastest pace since the 2020 pandemic. **Demand and Supply Outlook** The International Energy Agency (IEA) has revised its 2026 demand growth forecast downward to **850,000** barrels per day. Economic uncertainty and higher price points earlier in the year have weighed on consumption prospects. Global oil supply is projected to rise by **2.4 million** barrels per day in 2026. This growth is expected to be evenly split between OPEC+ and non-OPEC producers. With supply significantly outpacing demand, the market is facing a potential surplus of **3.7 million** barrels per day for the year, which continues to act as a ceiling for price rallies.

**Short-Term Yields Decrease Amid Surplus Liquidity**
Bond yields are currently undergoing a significant structural shift as markets transition into a new phase of the economic cycle. Short-term rates are trending lower, with 2-year Treasury yields recently touching 3.40%, their lowest level since 2022. This movement is largely driven by expectations of final easing measures and ample system liquidity. In contrast, long-term rates are moving in the opposite direction. The 10-year Treasury yield has recently climbed back toward 4.04%, while the 30-year yield remains elevated due to rising term premia. This divergence has pushed the yield spread between 2-year and 10-year notes to approximately 70 basis points, the widest gap in four years. This steepening of the yield curve signals that the era of aggressive rate cuts is likely nearing its conclusion. Central banks are shifting to a "neutral" stance, with the Federal Reserve expected to target a terminal rate between 3.0% and 3.5%. The market is now pricing in a "Goldilocks" scenario of resilient growth and stabilizing inflation, which reduces the immediate need for further monetary stimulus. Institutional investors are responding to this environment by shifting their strategies. Many are locking in long-term funding now to hedge against future volatility and potential rate increases. This institutional demand is focused on intermediate-term durations, typically between 5 and 7 years, to balance the benefits of current yields against the risks of rising long-term rates. Fiscal factors are also playing a primary role in the upward pressure on long-term yields. Massive government issuance and the financing costs of federal deficits are keeping the "long end" of the curve high. Investors are demanding a higher premium for holding long-dated debt, reflecting concerns over sticky inflation and the long-term supply of government bonds. The current market landscape is characterized by high-quality credit resilience. While corporate spreads remain historically tight, the divergence in yields suggests that liquidity is concentrated in shorter maturities while the broader market prepares for a "higher for longer" reality in the years ahead. This shift marks a definitive move away from the emergency policy settings of previous years toward a more traditional, upward-sloping yield environment.