Bearish News
Collection
Analysis of Current Commodity Market Correction and Duration Trends
Geopolitical risks remain the primary driver of market uncertainty as we move through early 2026. The World Economic Forum’s latest assessment identifies geoeconomic confrontation as the top global risk for the year, surpassing even traditional armed conflict. This reflects a "new age of competition" where trade wars, sanctions, and the weaponization of supply chains are the main tools of international pressure. Global risk indicators remain at historically high levels. Approximately **90%** of experts anticipate either a "turbulent" or "unsettled" global outlook over the next two years. Geoeconomic friction has climbed eight positions in risk rankings, with **18%** of analysts viewing it as the most likely trigger for a systemic crisis in 2026. Commodity markets are caught in the crossfire of these tensions. While some spot prices have stabilized, volatility remains a defining feature. Brent crude oil is projected to face an oversupplied market, yet prices maintain a geopolitical risk premium due to ongoing conflicts. Conversely, gold continues its record-breaking trajectory, fueled by central bank purchases averaging **70 tonnes** per month. Sector performance is increasingly split. Industrial metals like copper and aluminum are expected to outperform as the race for AI dominance and energy transition infrastructure intensifies. Copper prices are forecast to average **$11,400** per tonne in 2026, driven by supply deficits and strategic stockpiling. Meanwhile, the "LNG supply wave" is expected to surge by over **50%** through 2030, potentially reshuffling global energy dependencies. Economic indicators suggest a cooling but resilient global landscape. Global GDP growth is projected to hold steady at approximately **2.9%** for 2026. However, persistent inflation—ending last year at **2.9%** in the US—has stalled progress toward central bank targets. This stickiness, combined with "aggressive" tariff policies, has pushed the Global Economic Policy Uncertainty Index to all-time highs. Investors are navigating an environment where macro headlines often overshadow market fundamentals. The risk of "stagflationary shocks" remains a concern, particularly if trade restrictions intensify. As major powers secure spheres of interest, the cost of global trade is rising, ensuring that even if prices take a temporary breather, the underlying market tension is far from over.
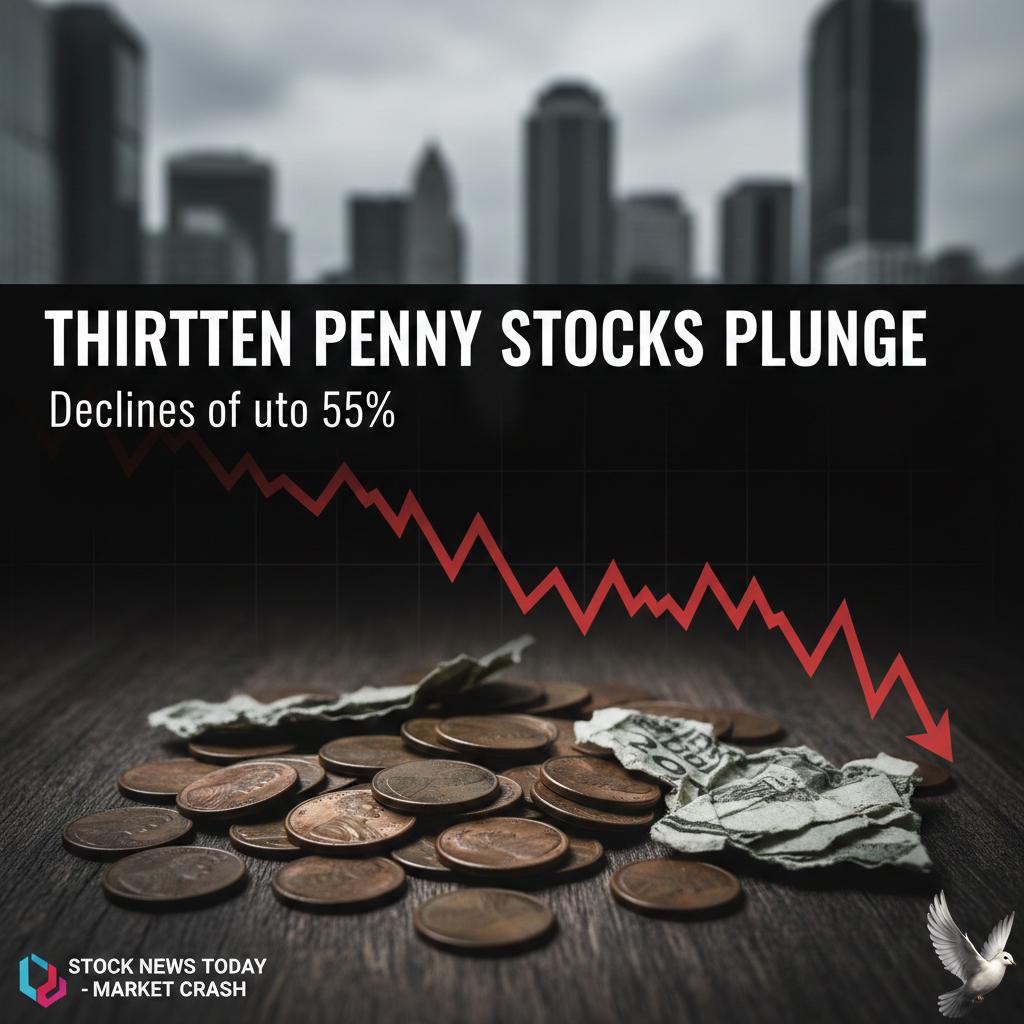
Thirteen Penny Stocks Record Monthly Declines of up to 55%
Penny Stock Market Alert: Significant Volatility Market analysis for mid-February 2026 indicates a sharp divergence in the micro-cap sector. While major indices like the **S&P 500** and **Dow Jones** are nearing record highs, a group of 13 specific penny stocks has faced severe selling pressure. Losses for these underperformers range from **15% to 55%** over the last 30 days. This trend highlights the fragility of companies with low market capitalization during periods of rapid sector rotation. Sector Performance & Decliners The most significant declines are concentrated in high-speculation sectors, including **Biotechnology**, **Cryptocurrency Mining**, and **Clean Energy**. * **FutureFuel Corp.** reported a net loss of **$37.39 million** for the recent nine-month period, contributing to a price decline that has left it trading at nearly half its estimated fair value. * **Caribou Biosciences** faces liquidity hurdles with less than **12 months** of cash runway remaining, leading to heightened investor caution. * **Aclaris Therapeutics** has seen its weekly volatility spike from **14% to 22%**, reflecting the broader instability in clinical-stage assets. Global Trends and Risks In international markets, the "penny stock" segment remains a high-stakes environment. In India, several stocks have crashed by up to **80%** over the last quarter, driven by rising input costs and tighter credit conditions. Global investors are increasingly prioritizing "Zero Debt" or "Debt-Free" balance sheets to mitigate risk. Companies without clear paths to profitability are being discarded as interest rates and regulatory scrutiny remain high. Key Risk Factors for February 2026 * **Liquidity Traps:** Many of these 13 decliners suffer from low trading volume, making it difficult for investors to exit positions without further driving down the price. * **Manipulation:** Small-cap stocks remain susceptible to "pump and dump" schemes and sudden negative announcements that can wipe out **30% or more** of value in a single session. * **Funding Gaps:** With AI-related infrastructure soaking up over **$3 trillion** in projected capital, smaller firms are finding it harder to secure affordable financing. Investors are currently shifting focus toward "turnaround stories" with tangible assets, such as those in **Renewable Energy** or **Infrastructure**, while avoiding pre-revenue entities that lack at least **two years** of cash runway.

Bitcoin Traders Identify $60,000 as Key Liquidation Level
**Bitcoin Market Pulse: The $60,000 Fault Line** Bitcoin is currently navigating a period of intense structural stress, trading near a decisive psychological and technical threshold. As of **February 14, 2026**, the market is characterized by "Extreme Fear," with sentiment indices bottoming out at a rare score of **9/100**. The focus remains fixed on the **$60,000** mark. This level serves as more than just a support line; it is a "tripwire" for broader financial contagion. A sustained break below this point is expected to ignite a sharp spike in volatility, moving the market from a standard correction into a potential liquidity crisis. **Liquidation Clusters and Leverage Risks** The risk is compounded by roughly **$1.24 billion** in open interest on Bitcoin put options at the **$60,000** strike price. As prices approach this level, options dealers may be forced to "delta-hedge" by selling Bitcoin or futures contracts, creating a feedback loop of downward pressure. Furthermore, Bitcoin-backed loans are nearing critical liquidation prices. If the market slides further, automated margin calls will trigger forced selling across decentralized and centralized platforms. This mechanical unwinding of leverage often leads to price "cascades" where selling begets more selling, independent of fundamental value. **Macro Pressures and Institutional Shifts** External economic factors are currently acting as a drag on digital assets. Recent U.S. inflation data, with Headline CPI at **2.4%**, has tempered expectations for immediate interest rate cuts. This "risk-off" environment has seen investors pivot toward safer assets, leaving Bitcoin to correlate more closely with struggling technology stocks. Institutional behavior has shifted from the aggressive accumulation seen in late 2025 to a more cautious stance. Spot Bitcoin ETFs have recorded billions in net outflows over recent weeks, signaling a depletion of the capital that previously fueled the bull market. **Technical Outlook and Support Zones** If the **$60,000** support fails to hold, analysts point to the 200-week Moving Average near **$58,000** as the next relevant defensive barrier. A breach there could open the door for a deeper retracement toward **$50,000**, where significant buyer interest is expected to re-emerge. Market activity reflects this uncertainty, with daily active addresses dropping toward **750,000**, down from previous highs above **900,000**. This reduction in network dynamism suggests a "wait-and-see" approach among retail and professional traders alike, as they gauge whether this level will hold as a floor or collapse into a deeper "crypto winter" phase.
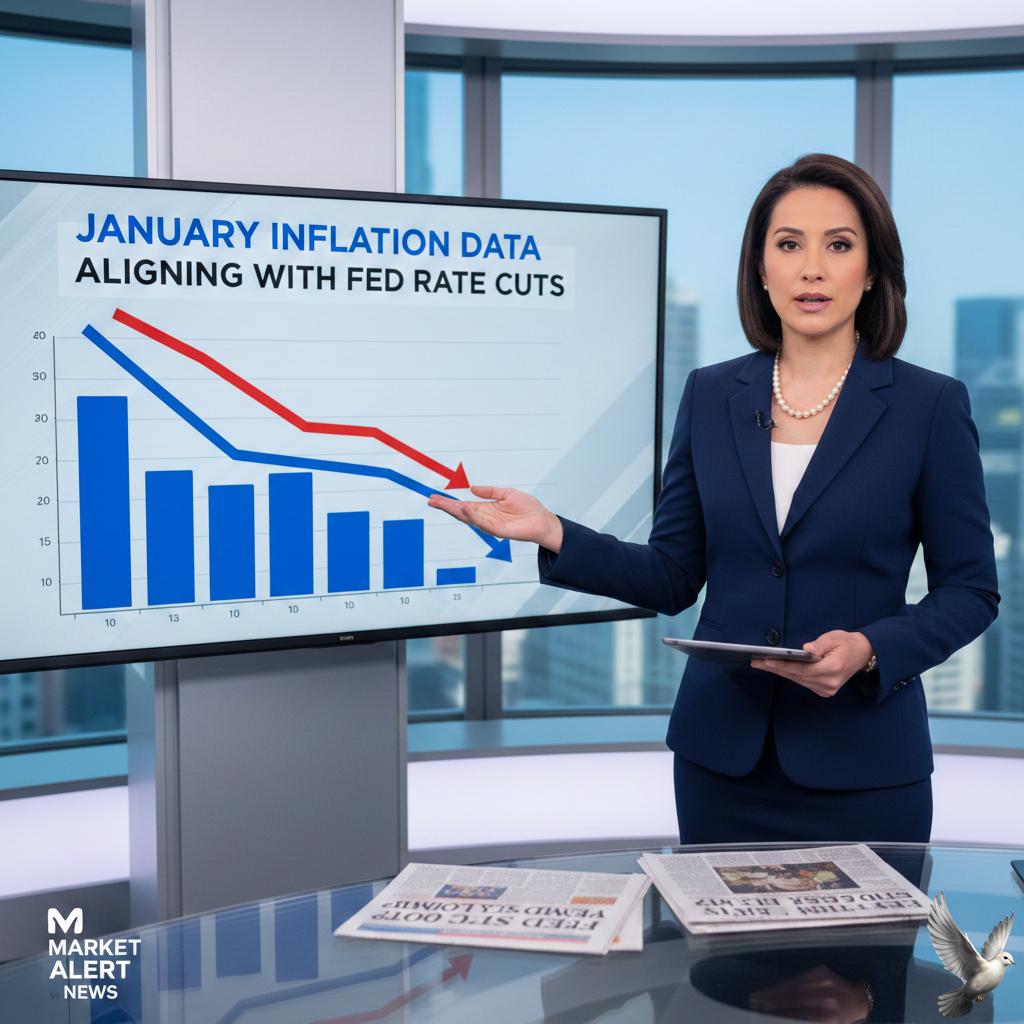
January Inflation Data Aligns With Potential Federal Reserve Rate Cuts
U.S. inflation cooled more than expected in January 2026, reaching its lowest annual level since mid-2021. The Consumer Price Index (CPI) rose **2.4%** year-over-year, coming in below the **2.5%** forecast and down from the **2.7%** recorded in December. On a monthly basis, prices edged up **0.2%**, trailing the **0.3%** increase seen in the previous month. This deceleration was largely driven by a sharp drop in energy costs. Gasoline prices plunged **3.2%** in January alone, contributing to a broader **1.5%** decline in the energy index. Core inflation, which strips out volatile food and energy sectors, remained stable but firm. The annual core rate slowed to **2.5%**, while the monthly core figure rose **0.3%**. Service-side inflation, particularly in shelter and airline fares, continues to present a hurdle. Shelter costs rose **0.2%** for the month, while airline tickets surged **6.5%**. The cooling data has shifted market expectations for Federal Reserve policy. Interest rate futures now price in a nearly **70%** probability of a rate cut in June, up from **64%** prior to the report. Analysts anticipate the Fed will likely maintain the current target range of **3.5% to 3.75%** through March while monitoring the labor market. Market reactions were immediate. Treasury yields fell as investors pivoted toward safety, with the **10-year note** finishing at **4.04%**—its lowest mark since November. The **2-year note** yield dropped to **3.40%**, hitting a level not seen since 2022. Equities experienced a sharp sell-off despite the positive inflation news. The **S&P 500** fell **1.6%** to **6,832.76**, and the **Nasdaq** dropped **2.0%** to **22,597.15**. This downturn was fueled by shifting sentiment around sector-specific profitability and volatility in the "Magnificent Seven" technology stocks. The labor market remains a critical secondary indicator. While January payrolls showed a resilient addition of **130,000** jobs, the unemployment rate held at **4.4%**. The Federal Reserve continues to balance these figures against a fiscal deficit projected to reach **$1.9 trillion** this year. Economic momentum is expected to fluctuate as the effects of 2025 trade policies and tariffs continue to filter through the supply chain. While headline inflation is moving toward the **2%** target, persistent service costs suggest that the path to aggressive rate cuts remains a cautious one for central bankers.

Infosys and Wipro ADRs Rise Despite Weak Wall Street Trade
Market dynamics for Indian IT giants shifted significantly on February 13, 2026, as US economic data and global technology trends intersected. ADR Resilience Amid US Inflation Shift Infosys and Wipro American Depository Receipts (ADRs) displayed unexpected resilience despite a volatile session on the Nasdaq. This movement coincided with the release of the January 2026 Consumer Price Index (CPI) report, which showed inflation cooling to **2.4%** on an annual basis. This figure came in lower than the **2.5%** expected by analysts, marking the slowest pace of price growth since mid-2025. The core inflation rate also eased to **2.5%**, fueling market speculation that the Federal Reserve may pivot toward rate cuts by June 2026. Domestic IT Sector Correction In contrast to the offshore ADR performance, the domestic Nifty IT index experienced a sharp correction. On February 13, the index plummeted over **5%** intraday, with heavyweights hitting fresh 52-week lows. Infosys shares dropped as much as **7.5%** to approximately **1,281.50**, while Wipro touched a low of **209.15**. This domestic sell-off was intensified by broader fears that traditional outsourcing models are facing structural revenue erosion from rapid advancements in generative AI. Employment and AI Disruptions Stronger-than-expected US employment figures have created a complex backdrop for the sector. January jobs data showed a robust labor market with unemployment at **4.3%**, suggesting that while inflation is cooling, the economy remains strong enough to delay aggressive monetary easing. Simultaneously, the sector is grappling with "AI deflation" risks. Industry analysts estimate that **9% to 12%** of traditional IT services revenue could be at risk over the next three to four years as clients utilize AI to automate routine coding, testing, and maintenance tasks. Market Performance Summary The tech-heavy Nasdaq Composite felt the heat of a broader tech sell-off, tumbling **2%** to close at **22,597.15** points. While the cooling CPI provided a momentary lift to sentiment, the high CBOE Volatility Index (VIX) at **20.82** signals continued caution. Investors are currently weighing the benefits of potential lower interest rates against the long-term threat of AI-driven disruption to headcount-based revenue models. Foreign investors have responded by offloading an estimated **$8.5 billion** in Indian IT stocks over the past year.
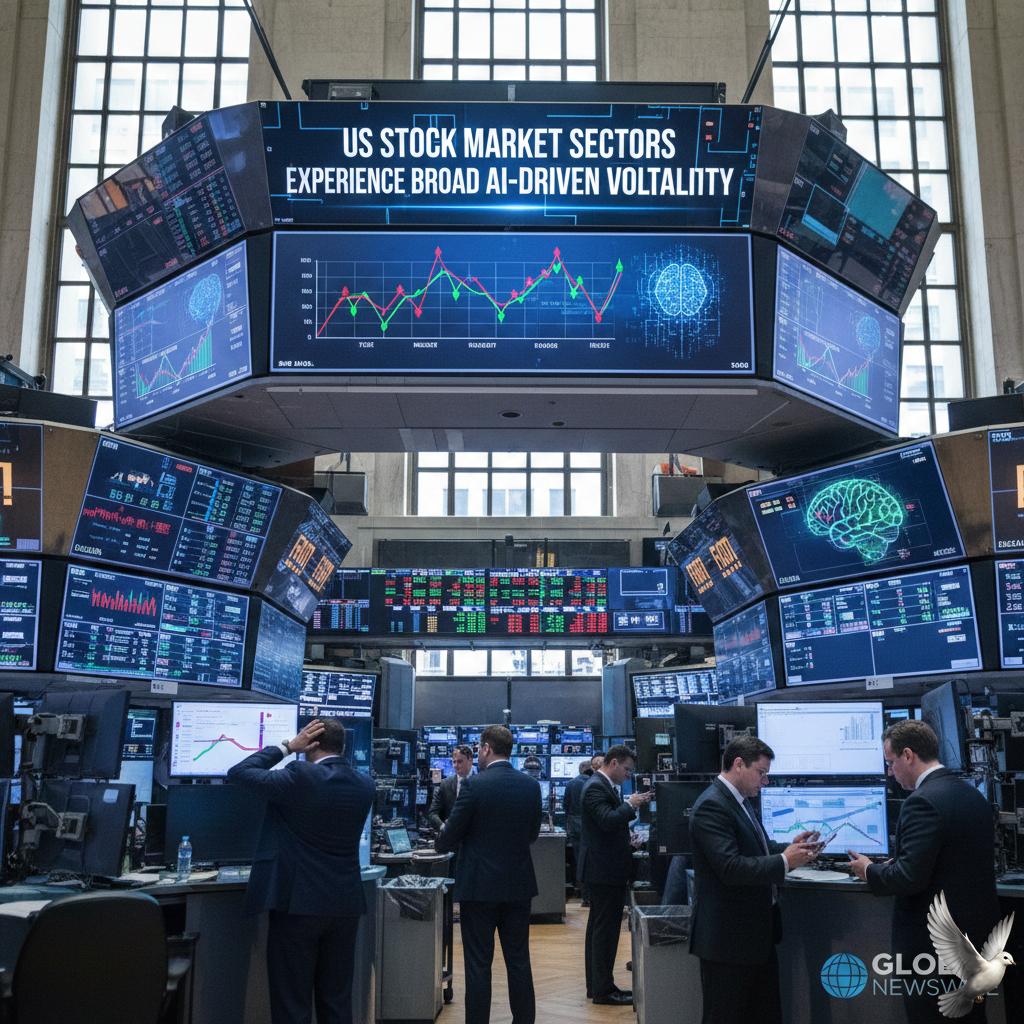
US Stock Market Sectors Experience Broad AI-Driven Volatility
Market Brief: The AI Disruption Scare Wall Street is currently navigating a period of intense volatility as a "scare trade" regarding artificial intelligence (AI) shifts from optimism to widespread disruption fears. The sentiment has evolved from viewing AI as a universal growth engine to identifying it as a primary threat to established business models. The sell-off initially hit the software sector with significant force. The S&P North American Technology Software Index has tumbled 19% since the start of the year, while the iShares Expanded Tech-Software Sector ETF (IGV) has plunged 31% from its peak, officially entering bear market territory. Market panic deepened this week following the release of advanced "agentic" AI models capable of automating complex professional workflows. Investors are aggressively offloading shares in companies perceived as vulnerable to these autonomous tools, leading to a "sell first, think later" mentality across trading floors. Sectoral Impact and Key Losses: Software & IT: The software/IT sector has seen a sharp repricing. Loan prices in the syndicated market fell nearly 465 basis points in just one month, reaching an average bid of 90.4 on February 6, 2026. Infrastructure & Networking: Cisco Systems saw its shares plummet 12% after providing disappointing guidance, which many analysts interpreted as a sign of shifting enterprise spending cycles away from legacy hardware. Transportation & Logistics: The Dow Jones Transport Average sank 4% in a single session. Logistics leader C.H. Robinson plunged 14% on fears that AI-driven automation will compress margins and displace traditional freight brokerage services. Financial Services: Major firms including Morgan Stanley and Goldman Sachs saw declines between 3% and 5%. The market is actively debating how AI-driven wealth management platforms might erode traditional advisory revenue streams. Real Estate & Tech-Services: Concerns regarding AI-induced job losses have spilled into real estate, with CBRE falling 9%. High-valuation marketing platforms like AppLovin have also been hit hard, tumbling nearly 20% amid intense competitive pressure. Despite the rout in "AI losers," the infrastructure race continues at a record pace. The top five U.S. hyperscalers—Amazon, Microsoft, Alphabet, Meta, and Oracle—have committed to a staggering $690 billion in capital expenditure for 2026. This represents a near-doubling of investment from 2025 levels. While pure-play AI vendors like OpenAI have reached an annual recurring revenue of $20 billion, this remains a fraction of the capital being deployed. This widening gap between massive spending and actual monetization is contributing to a "prove it" year for the technology. Investors are currently rotating capital into defensive havens to hedge against further volatility. Retail giants like Walmart and consumer staple stocks like Coca-Cola have bucked the downward trend, gaining ground as traders reposition for a more cautious economic landscape.

Rising Yields Prompt Indian Bond Traders to Seek Buybacks Amid Debt Switch Performance
The Indian government bond market is navigating a complex period of transition as participants weigh the impact of recent debt management operations against long-term borrowing pressures. Market yields recently retreated from near one-year highs following a significant debt switch conducted by the government and the Reserve Bank of India (RBI). In this operation, the government bought back securities worth **755.04 billion rupees** maturing in the 2026-27 fiscal year, issuing longer-dated **2040 bonds** totaling **694.36 billion rupees** in exchange. The move was designed to ease immediate redemption pressures. However, the initial gains in bond prices have proven fragile. The benchmark 10-year bond yield currently hovers around **6.67%**, having hit a three-week low on February 13, 2026. While the debt switch provided temporary relief, traders remain cautious as the government prepares for a record gross borrowing target of **17.2 trillion rupees** for the upcoming 2026-27 fiscal year. Liquidity remains a primary concern for the market. While system liquidity has stayed in a surplus of approximately **70,000 crore rupees**, participants argue that further central bank support is necessary to cool yields permanently. Specifically, there is high demand for more frequent buyback auctions or Open Market Operation (OMO) purchases to absorb the heavy supply of state and central government debt. Economic indicators are adding to the cautious sentiment. January inflation returned to the RBI's target band at **2.75%**, slightly higher than some market expectations. This uptick, combined with the RBI maintaining its "neutral" stance and holding the repo rate at **5.25%** in its February meeting, suggests that interest rate cuts are not imminent. Additional pressure is stemming from the state development loan (SDL) segment. Indian states recently conducted their largest weekly auction of the fiscal year, raising **486 billion rupees**. This massive supply has kept the 10-year yield from breaking below the **6.65%** resistance level. Market participants are now looking for a clearer roadmap on further buybacks. Without consistent intervention to manage the supply-demand mismatch, many analysts expect yields to remain sticky at current levels, despite the successful execution of the recent debt switch.
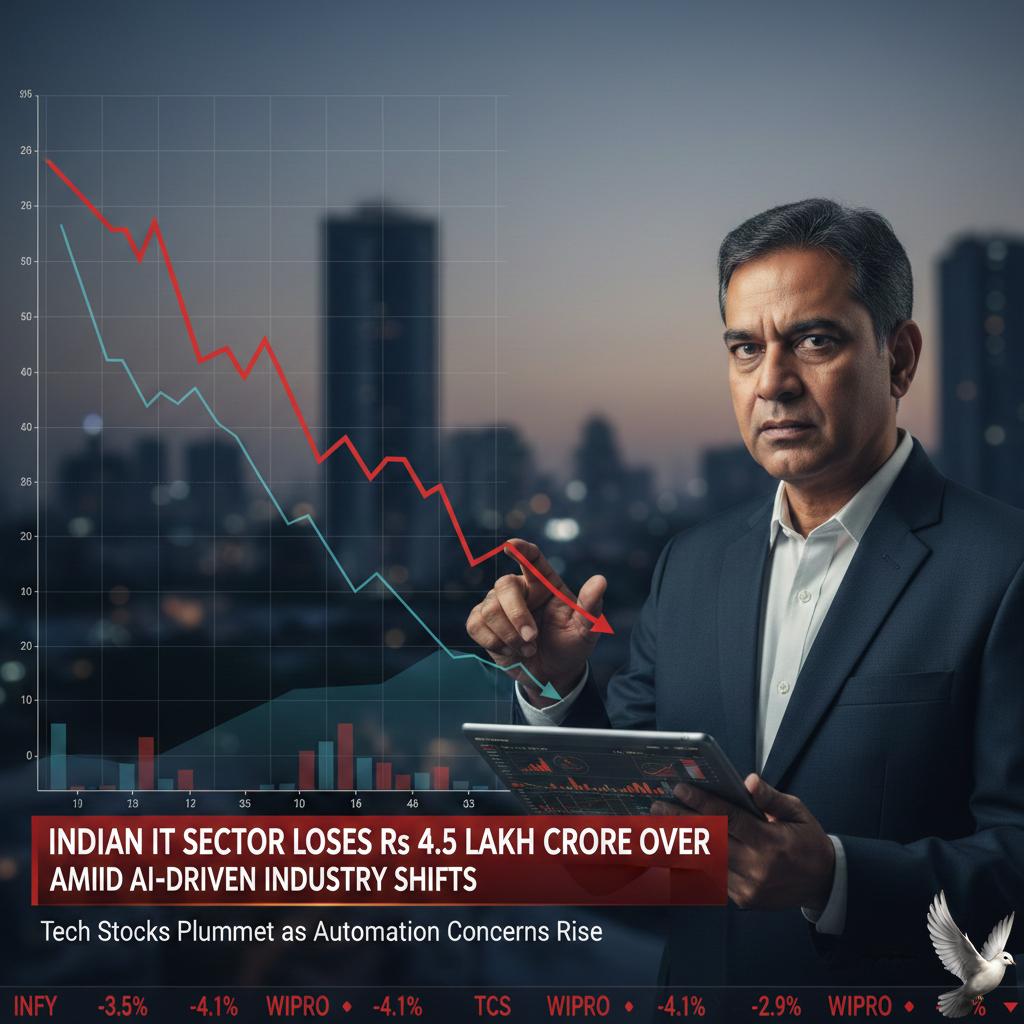
Indian IT Sector Loses Rs 4.5 Lakh Crore Over Seven Days Amid AI-Driven Industry Shifts
The Indian software services landscape is grappling with a severe structural downturn as of February 13, 2026. A massive sell-off, catalyzed by rapid advancements in autonomous AI agents, has triggered a significant valuation reset across the sector. On February 12, the **Nifty IT Index plummeted 5.51%**, closing at **33,160.20**. This single-session crash wiped out approximately **$52 billion** in market capitalization. The index has now slid more than **12.16% since the start of 2026**, reflecting deep-seated investor anxiety. Market Dynamics and Weightage The sector's dominance in the national benchmark is fading. The IT sector’s weightage in the Nifty 50 has contracted to **9.2%**, down from **10.8%** earlier this month. This shift has seen the Information Technology segment lose its long-held second-place position to the Oil & Gas sector, which now stands at **10.1%**. Stock Performance and ADR Trends The decline is broad-based across industry giants. **TCS** shares hit a 52-week low of **₹2,776**, while **Infosys** and **Wipro** faced intense pressure. Overnight trading of American Depository Receipts (ADRs) signaled further pain, with **Infosys ADRs tanking nearly 10%** on the New York Stock Exchange. Other major players including **HCL Technologies**, **Tech Mahindra**, and **LTIMindtree** recorded losses between **4% and 6%**. The AI Disruption Factor The primary trigger for this "valuation reset" is the emergence of highly specialized AI tools, such as Anthropic’s latest professional automation suite. Unlike previous technology cycles like cloud migration, which created new work streams, AI is perceived as a deflationary threat to the labor-driven outsourcing model. Industry analysts warn that AI could automate up to **40% of traditional revenue streams** in coding, maintenance, and testing. Emerging tools are now capable of completing complex tasks—such as SAP migrations or legal contract reviews—in weeks rather than the years typically billed by IT firms. Sector Outlook While the industry body Nasscom has labeled fears of a total bypass as "misplaced," the market remains in a risk-off mode. Investors are transitioning from a period of experimental hype to a "Year of Truth," demanding proof of how these firms will monetize AI to offset the loss of traditional man-hour billing. The coming trading sessions are critical. The Nifty IT Index is currently testing multi-month lows, and a failure to hold these technical levels could invite further volatility. The sector is now forced to pivot toward an asset-led model, focusing on AI governance and enterprise integration to survive the shifting tech landscape.

Indian Bond Prices Expected to Increase Following Debt Switch Strategy
Indian government bonds are navigating a period of recalibration following the Union Budget 2026 and recent shifts in the central bank’s management strategy. The market is currently balancing a record-high borrowing plan against a favorable inflation cooling and strategic debt operations. **Debt Management and Yield Trends** The Reserve Bank of India (RBI) is actively managing redemption pressures through debt switch operations. This maneuver involves exchanging short-term maturing securities for longer-dated bonds to smooth out the repayment profile and lower immediate gross borrowing needs. The benchmark 10-year government bond yield has recently hovered around **6.71% to 6.73%**. While yields touched a one-year high of **6.78%** in early February due to supply concerns, they have since stabilized. Market sentiment remains cautious as traders assess the government's ability to absorb the upcoming supply. **Budgetary Impact and Borrowing Targets** The Union Budget for the 2026-27 fiscal year set a record gross market borrowing target of **₹17.2 trillion**. This figure exceeded initial market expectations of **₹16.5 trillion**, creating temporary upward pressure on yields. Net market borrowing is estimated at **₹11.7 trillion**. Despite the high volume, the government is maintaining fiscal discipline, with the fiscal deficit target narrowed to **4.3%** of GDP for the upcoming year, down from the **4.4%** revised estimate for the current period. **Inflation Hits New Lows** A significant tailwind for the bond market is the sharp drop in retail inflation. India’s Consumer Price Index (CPI) inflation fell to **2.75%** in January 2026, marking the first reading under the newly revised 2024 base series. This print is well within the RBI’s medium-term target of **4%** and comfortably below the upper tolerance band of **6%**. The new CPI series has reduced the weight of food and beverages to **36.8%** from the previous **45.9%**. This structural change is expected to lower headline volatility, as the food segment—historically the most unstable—now has a smaller impact on the overall index. **Liquidity and Market Outlook** Liquidity conditions in the banking system are currently steady, supported by previous RBI interventions. The central bank recently injected substantial liquidity, including bond purchases worth **₹6.50 trillion** over the past year and significant foreign exchange swaps. The inclusion of Indian debt in global bond indices continues to support long-term foreign capital inflows. While the immediate focus remains on heavy state-level bond auctions—with states recently raising **₹486 billion** in a single week—the combination of low inflation and disciplined fiscal targets provides a stable foundation for the domestic debt market. [India Bond Yield Analysis](https://www.youtube.com/watch?v=fF-hXxjFuVs) This video provides an expert breakdown of the recent Union Budget fiscal math and explains why bond yields remain elevated despite broader economic stabilization. http://googleusercontent.com/youtube_content/0

**Oil Prices Face Weekly Decline Amid Easing Geopolitical Tensions and Oversupply Concerns**
Global Energy Market Brief: February 13, 2026 Crude oil futures experienced a sharp decline this Friday, heading toward a second consecutive weekly loss. The market is currently balancing a significant supply surplus against lingering geopolitical risks in the Middle East. Price Action and Benchmarks Brent crude futures fell by **$1.88** to settle at **$67.52** per barrel, a drop of **2.71%**. Simultaneously, U.S. West Texas Intermediate (WTI) declined by **$1.79**, or **2.77%**, closing at **$62.84**. Despite a mid-week rally that saw Brent briefly approach the **$70** mark, gains were erased as technical resistance met bearish fundamental data. The weekly trend remains negative, reflecting a broader cooling of the "war premium" that had supported prices earlier in the year. Supply and Demand Outlook The International Energy Agency (IEA) has revised its 2026 demand growth forecast downward to **850,000** barrels per day (bpd), citing high prices and economic uncertainty. This stands in contrast to OPEC’s more optimistic projection of **1.38 million** bpd. Global oil supply is projected to rise by **2.4 million** bpd in 2026. This growth is expected to create a substantial surplus of approximately **3.7 million** bpd, the largest buffer seen since the 2020 pandemic. Inventory and Production Data U.S. commercial crude inventories surged by **8.5 million** barrels last week, reaching a total of **428.8 million** barrels. This was the largest weekly build in over a year and far exceeded analyst expectations of a modest **793,000** barrel increase. Domestic U.S. production has recovered from recent winter disruptions, rising by nearly **500,000** bpd. Meanwhile, OPEC+ production fell by **439,000** bpd in January due to outages in Kazakhstan and Russia, though these volumes are expected to return to the market through February. Geopolitical Factors Tensions between the U.S. and Iran remain a focal point for volatility. While initial hopes for a diplomatic breakthrough cooled, recent remarks from President Donald Trump suggesting no definitive agreement has been reached added to the uncertainty. The market continues to monitor the Strait of Hormuz, where a potential disruption could impact the **20 million** barrels of oil—roughly **20%** of global consumption—that transit the waterway daily. However, the current inventory overhang provides a significant cushion against localized supply shocks.
India Government Bond Yields Decline Following Inflation Report
Indian government bonds witnessed a shift in sentiment on Thursday, February 12, 2026, as investors reacted to the first set of data released under India’s newly revised inflation series. The benchmark 10-year G-Sec yield was last quoted at approximately 6.72%, reflecting a market that is finding its footing after a period of volatility following the Union Budget. A primary driver for the current market action is the January inflation reading, which came in at 2.75%. This figure was slightly higher than some economist projections of 2.4% but notably returned to the Reserve Bank of India’s (RBI) target band of 2% to 6%. This print is the first to use the new 2024 base year, which notably reduced the weight of food in the consumer basket to 36.8% from the previous 45.9%. Market participants are currently unwinding short positions as the 2.75% print eased immediate fears of a runaway spike in prices. While food inflation stood at 2.13% and housing at 2.05% under the new metrics, a significant surge in personal care and miscellaneous goods—which reached 19.0%—has kept traders cautious. The broader backdrop for the bond market remains influenced by the RBI’s February 2026 policy decision, where the Monetary Policy Committee (MPC) unanimously voted to keep the repo rate unchanged at 5.25%. This followed a 25-basis-point cut in December 2025. The central bank has maintained a neutral stance, emphasizing a "wait and watch" approach as it evaluates the impact of previous cuts and the new inflation data series. Supply-side pressures continue to cap a more aggressive rally in bond prices. The government’s proposed gross market borrowing of 17.2 lakh crore for the upcoming fiscal year has kept yields near eleven-month highs. Additionally, state government bond auctions have been heavy, with states recently raising 486 billion rupees—the largest weekly auction of the current financial year. Liquidity in the banking system remains in a surplus of roughly 70,000 crore per day, supported by earlier RBI interventions and open market operations. However, global headwinds, including a rise in the US 10-year Treasury yield toward 4.18% and a weakening Rupee—which recently hit levels near 91 per dollar—have limited the domestic market’s ability to sustain lower yields. The 10-year 6.48% 2035 bond, a key focus for long-term investors, has seen its yield settle into a range around 6.72%. While the lower-than-feared inflation print provided a temporary reprieve, the market remains balanced between a benign domestic inflation trajectory and the persistent pressure of high government borrowing needs. [India 10-Year Bond Yield Analysis](https://www.youtube.com/watch?v=z01RGOV-ZNw) This video provides an expert analysis of the latest borrowing impacts and inflation dynamics affecting the Indian debt market. http://googleusercontent.com/youtube_content/0

Hindalco Shares Monitored as Novelis Facility Fire Delays Restart and Impacts Cash Flow
Hindalco Industries shares are under intensified scrutiny as of February 12, 2026, following critical operational updates from its US subsidiary, Novelis. The company confirmed a significant delay in the restart of its Oswego hot mill in New York after two major fire incidents in late 2025. The financial impact of these disruptions is now estimated to hit free cash flow by $1.3 billion to $1.6 billion (approximately ₹14,400 crore). While total liquidity remains stable at $2.6 billion, the group’s net leverage ratio has climbed to 3.7x. To stabilize the subsidiary’s balance sheet, Hindalco provided a strategic equity infusion of $750 million in December. Novelis reported a net loss of $160 million for the third quarter of fiscal year 2026, a sharp reversal from the $110 million profit recorded in the same period last year. Total shipments fell by 11% to 809 kilotonnes, largely due to the 72-kilotonne production shortfall at the Oswego facility. Despite these headwinds, operational efficiency remains high, with Adjusted EBITDA per tonne rising 6% year-on-year to $430. The recovery timeline for the Oswego hot mill has been pushed to late Q2 of the 2026 calendar year. Management expects that 70% to 80% of the financial losses related to property damage and business interruption will be recoverable through insurance. However, the immediate cash flow pressure remains a primary concern for investors. In the broader market, Hindalco’s stock price has shown resilience despite these updates, trading near ₹966 as of the latest close. The metal sector is currently benefiting from multi-year highs in global aluminum prices, which reached approximately $3,130 per tonne in January 2026. This price surge has helped offset some of the domestic concerns, with analysts highlighting a potential 20% upside in future earnings if aluminum prices remain elevated. Operational focus is also shifting to the massive $5 billion greenfield project in Bay Minette, Alabama. Commissioning of the cold mill at this site is scheduled to begin in March 2026. This facility is expected to eventually deliver 600 kilotonnes of capacity, positioning the company to capture long-term growth in the beverage packaging and aerospace sectors once current disruptions are resolved.

Oil Prices Gain 2% Amid US-Iran Geopolitical Tension and Demand Growth
Crude oil prices surged by more than 1% on Wednesday, with market activity dominated by escalating geopolitical risks in the Middle East. West Texas Intermediate (WTI) climbed past 64.50 per barrel, while Brent crude moved above the 70.00 threshold. This upward momentum reflects a significant risk premium as traders weigh the possibility of direct confrontation between the U.S. and Iran. Tensions have intensified following reports that Washington is considering the interception of tankers carrying Iranian crude. The potential deployment of an additional carrier strike group to the region has further heightened fears of supply disruptions. While diplomatic channels remain open, the market is pricing in the threat of retaliatory actions or strikes that could jeopardize flows through critical maritime corridors. The geopolitical rally is currently contending with a surge in domestic supply. The latest industry data revealed a sharp build in U.S. crude inventories, which rose by 13.4 million barrels last week. This represents the largest weekly increase since late 2023. Additionally, gasoline stockpiles reached a 5.5-year high, and domestic crude production remains near record levels at 13.7 million barrels per day. Despite the inventory build, physical market indicators suggest pockets of tightening. Distillate stockpiles fell by 2.7 million barrels, surpassing analyst expectations for a smaller draw. Furthermore, a slightly weaker U.S. dollar has provided an additional floor for prices, making dollar-denominated oil more attractive to international buyers. The broader outlook for the year remains a tug-of-war between immediate risk and long-term surplus. The International Energy Agency (IEA) has warned that global supply is on track to outpace demand, potentially resulting in a sizable surplus. While January saw Brent prices average 67.00 due to weather-related disruptions and conflict risks, many analysts expect a downward trend later in the year as production growth from non-OPEC+ nations continues to climb. Market participants are now shifting their focus to upcoming monthly reports from OPEC and the IEA. These assessments will be critical in determining whether the current geopolitical premium can withstand the pressure of rising global stockpiles and a projected slowing of demand growth in major economies.

Oil Prices Remain Stable Amid Geopolitical Tension
Oil markets remained stable this Wednesday as traders balanced signs of diplomatic progress with persistent geopolitical risks. Brent crude futures held firm at approximately 69.03 per barrel, while West Texas Intermediate (WTI) stood at 64.19. The market is currently trapped between a potential easing of tensions and the threat of fresh supply disruptions. A primary focus for investors is the ongoing negotiation between the U.S. and Iran. While recent talks in Oman were described as a step forward, significant hurdles remain regarding Iran's nuclear program. Tehran has expressed a willingness to continue the diplomatic track, yet the U.S. administration has signaled it may increase its military presence in the Middle East if negotiations stall. Geopolitical premiums are further supported by a new U.S. trade agreement with India. This deal reportedly includes a freeze on Russian oil imports by New Delhi, one of the world's largest buyers of Russian crude. Any significant shift in these trade flows could tighten global supply and put upward pressure on prices. On the supply side, the American Petroleum Institute reported a substantial crude inventory build of 13.4 million barrels for the week ending February 6. This figure far exceeded analyst expectations of a modest 800,000-barrel increase. Official data from the Energy Information Administration (EIA) is expected later today to confirm if domestic stocks are indeed surging. Global demand outlooks remain mixed for the 2025-2026 period. The IEA projects demand growth will average around 1.1 million barrels per day in 2025, driven largely by the petrochemical sector in China and India. However, this growth is being met by rising production from non-OPEC+ nations, particularly the U.S., Brazil, and Canada. Market participants are also watching OPEC+ closely. The group is currently maintaining steady output through March, following a year in which oil prices saw their steepest annual decline since 2020. With a projected global surplus on the horizon, the cartel faces the challenge of balancing market share against price stability. In the short term, crude is expected to fluctuate within its current range. Significant movement will likely depend on concrete outcomes from the U.S.-Iran talks or evidence that geopolitical tensions are materially impacting the 20 million barrels of oil that pass daily through the Strait of Hormuz.

Large State Bond Supply Expected to Weigh on Indian Sovereign Debt Market
The Indian sovereign bond market is facing a period of intense volatility this Tuesday, February 10, 2026. A massive influx of state-level debt has collided with a cautious stance from the central bank, driving benchmark yields toward one-year highs and dampening investor appetite. Market participants are currently absorbing the largest weekly state-bond auction of the current financial year. Indian states are aiming to raise **486.15 billion rupees** ($5.37 billion) through today's bond sales. This quantum is roughly **60 billion rupees** higher than originally scheduled, significantly increasing the supply pressure on a market already struggling with limited liquidity. The benchmark 10-year government bond yield has responded sharply to these pressures, climbing to approximately **6.76%**. This marks a notable spike from previous sessions and reflects a broader trend of rising borrowing costs. Yields on the 6.48% 2035 bond have also trended upward, recently touching the **6.7609%** mark as traders adjust to the heavy issuance. Sentiment remains fragile following the Reserve Bank of India’s (RBI) monetary policy decision on February 6. The central bank opted to maintain the repo rate at **5.25%** and held its "Neutral" stance. While the rate hold was expected, the market was disappointed by the lack of fresh liquidity support measures. With the RBI refraining from additional debt buying, private bank traders indicate that yields may continue to face upward pressure until a new equilibrium is found. Domestic banking institutions, the primary buyers of government debt, are currently exhibiting limited demand. Lenders are grappling with a deposit shortfall and tight rupee liquidity, partly driven by the central bank's previous interventions to stabilize the currency. The rupee has recently weakened beyond the **90 per dollar** mark, further complicating the outlook for interest rate cuts in the near term. Economic indicators suggest a complex backdrop. While the RBI has nudged its FY26 GDP growth forecast to **7.4%**, inflation projections for the final quarter have been adjusted to **3.2%** due to rising precious metal prices and base effects. Investors are now looking toward upcoming economic releases, including January inflation data due later this week, for signals on the next policy move. For now, the combination of heavy supply and a "prolonged pause" from the RBI suggests that the bearish trend in bond prices—and the corresponding rise in yields—is likely to persist through the remainder of the quarter.

Oil prices soften as market assesses supply outlook and geopolitical developments
Oil markets are currently navigating a landscape of shifting geopolitical risk and high-stakes diplomacy. On Tuesday, February 10, 2026, West Texas Intermediate (WTI) crude futures are holding steady near **$64.31** per barrel, while Brent crude is trading at approximately **$69.00**. Price action follows a period of heightened volatility. Just days ago, markets saw a significant **2%** surge after a series of military escalations. These events included the downing of a drone near a U.S. aircraft carrier and reports of armed vessels approaching tankers. The Strait of Hormuz remains the focal point for supply concerns. Roughly **21%** of global oil consumption passes through this narrow waterway. Recent U.S. navigational advisories warning American-flagged ships to avoid Iranian waters have reinforced the risk premium currently baked into prices. Diplomatic efforts are running in parallel with these tensions. While negotiations in Oman have been described as a "step forward," a definitive breakthrough remains elusive. Iran continues to maintain its stance on uranium enrichment, which remains a primary point of contention for U.S. officials. Fundamental supply data is also influencing the market. Recent figures from the American Petroleum Institute (API) revealed a substantial draw of **11.1 million** barrels in U.S. crude stocks. This was significantly larger than the modest draw analysts had anticipated. Broader demand trends show a global market in transition. For 2026, global oil demand growth is projected to reach **1.1 million** barrels per day. China continues to be the largest source of growth, though its expansion is increasingly driven by the petrochemical sector rather than traditional fuels. On the supply side, non-OPEC+ producers are filling the gap. Output from the United States, Canada, and Brazil is expected to expand by **1.4 million** barrels per day this year. This production surge from the Americas is currently outpacing the rate of demand growth. Market participants are also monitoring trade dynamics in Asia. New trade agreements involving India have linked future energy deals to a freeze on certain imports, potentially shifting long-standing flow patterns for global crude. Economic forecasters expect a continued oversupply in the coming months. Projections suggest global oil inventories could build by as much as **2.8 million** barrels per day through 2026. This potential surplus is expected to keep long-term price targets for Brent near the **$56** mark as the year progresses.

Bajaj Electricals Q3 Results: Net Loss of Rs 34 Crore on 18% Revenue Decline to Rs 1,050.9 Crore
Bajaj Electricals reported a challenging set of financial results for the quarter ended December 2025, swinging to a consolidated net loss of 34.10 crore. This performance marks a significant downturn compared to the net profit of 33.36 crore recorded in the same period last year. The company’s revenue from operations faced a steep decline of 18.5%, falling to 1,050.91 crore from 1,289.72 crore in the previous year's corresponding quarter. The bottom line was primarily impacted by an exceptional loss of 28.89 crore, largely attributed to one-time costs associated with the implementation of the new Labour Codes. Operational efficiency was further tested by a contraction in gross margins and general inflationary pressures. Before accounting for exceptional items and taxes, the company reported a loss of 20.28 crore for the quarter under review. Market sentiment reacted sharply to these figures on February 9, 2026. Shares of Bajaj Electricals were trading at approximately 412.70 on the NSE, reflecting a 0.49% decline during the session. The stock has faced persistent pressure over the last 12 months, losing over 41.8% of its value and reaching a 52-week low of 382.90 recently. The broader consumer durables sector is currently navigating a period of structural transition. While the Indian market is projected to grow to over $30 billion by 2027, companies are currently grappling with the immediate financial burden of higher social security obligations and revised wage definitions under the new national labor framework. Despite the quarterly setback, industry analysts point to potential recovery drivers in the coming months. The Union Budget 2026 has introduced duty rationalization on components for appliances like microwave ovens and allocated 1,004 crore for energy-efficient lighting and air conditioning under the PLI scheme. Bajaj Electricals remains focused on its premiumization strategy, particularly through its Morphy Richards and Nirlep brands. Management has previously indicated a price hike of 1% to 3% across its fans and appliances portfolio to offset rising input costs and stabilize margins through the remainder of the fiscal year.

Indian Sovereign Bond Yields Rise Amid Increased State Debt Issuance and Post-RBI Policy Adjustments
Indian government bonds are facing significant selling pressure as the market reacts to a dual challenge of heavy supply and the central bank's cautious stance. The benchmark 10-year government bond yield has climbed to approximately 6.76%, marking one of its highest levels in the past year. This spike follows the Reserve Bank of India's (RBI) February 2026 monetary policy meeting, where officials kept the repo rate unchanged at 5.25% and maintained a "neutral" stance. Market sentiment was dampened by the absence of fresh liquidity-easing measures. While the RBI has already reduced policy rates by 125 basis points since early 2025, traders had anticipated more aggressive support to counter a persistent deposit shortfall in the banking system. Instead, the central bank’s decision to withhold extra durable liquidity has fueled concerns that yields may continue to stay elevated. State government borrowing is adding further weight to the market. Indian states recently targeted a massive issuance of 486.15 billion rupees in a single week—the largest of the current financial year. This surge in state debt supply is competing for limited investor appetite, as many commercial banks are currently reluctant to expand their bond holdings due to tight liquidity and rising credit demand. The broader fiscal outlook remains a point of focus for bondholders. The federal budget has set a record gross borrowing target of 17.20 trillion rupees for the upcoming 2026-27 financial year, representing a 17% increase over previous levels. With the government’s fiscal deficit projected at 4.2% and total state and central debt supply expected to exceed 30 trillion rupees, the market is bracing for a sustained supply-demand imbalance. Investors are now closely monitoring secondary market activity and potential foreign portfolio inflows for relief. However, with the rupee trading near 90.55 against the US dollar and capital flows remaining volatile, the yield curve is expected to remain under pressure. Market participants suggest that without proactive intervention or a significant shift in liquidity management, bond yields may hover between 6.60% and 6.75% for the remainder of the quarter. [India 10-Year Bond Yield Historical Data](https://www.youtube.com/watch?v=W7-iaZpORkQ) This video provides a deep dive into how the massive supply of government debt and the latest budget figures are testing the resilience of the Indian bond market. http://googleusercontent.com/youtube_content/0

Oil Prices Steady Amid Ongoing U.S.-Iran Diplomatic Discussions
**Energy Market Brief: February 9, 2026** Global oil prices opened the week on a downward trend as diplomatic progress between the United States and Iran significantly reduced the "war premium" that has recently inflated energy costs. Brent crude futures fell **1.31%** to trade at **$67.16** per barrel, while U.S. West Texas Intermediate dropped **1.24%** to **$62.76**. This market cooling follows a breakthrough in indirect nuclear talks mediated by Oman. While Iran remains the fifth largest producer in the OPEC+ alliance—pumping approximately **3.3 million** barrels per day—the threat of a military escalation that could shutter the Strait of Hormuz has eased. Traders had previously priced in the risk of losing nearly **20%** of the world’s daily petroleum liquids that transit through this narrow chokepoint. Despite the softening prices, geopolitical friction remains a central theme. Iran recently issued a stern warning that any regional conflict would place U.S. military bases in its crosshairs. This rhetoric keeps a baseline of volatility in the market, even as the immediate fear of supply disruption fades. In Europe, the energy landscape is tightening further due to new regulatory measures against Moscow. The European Union has officially entered a new phase of restrictions, effectively moving toward a total ban on maritime services for Russian crude exports. This shift replaces the previous price cap system with a more aggressive prohibition on insurance, shipping, and technical assistance. Brussels is specifically targeting the "shadow fleet" of aging tankers used to bypass international sanctions. Current data shows that the EU has already blacklisted over **100 vessels** and is weighing further sanctions on an additional **43 ships**. Furthermore, the price cap for Russian crude has been adjusted downward to **$44.10** per barrel to further squeeze export revenues. The OPEC+ coalition continues to prioritize market stability through production restraint. Eight core members, led by Saudi Arabia and Russia, confirmed they will maintain steady output levels through the end of March. This decision halts a planned unwind of voluntary cuts totaling **2.2 million** barrels per day. The group is expected to meet again on March 1 to determine if seasonal demand shifts warrant a return of these barrels to the global market. In the United States, production remains at record levels, though growth is starting to plateau. Forecasters expect domestic output to hover around **13.6 million** barrels per day throughout the year. While U.S. supply provides a buffer against Middle Eastern instability, any sustained drop in global prices below the **$60** mark may trigger a slowdown in new drilling activity later this year.

Goldman Sachs Traders Anticipate Continued Equity Market Volatility
US equity markets are navigating a period of intense technical volatility as systematic selling pressure collides with record-breaking price levels. Despite the S&P 500 recently crossing the historic 7,000 threshold, the market remains vulnerable to large-scale liquidations from algorithmic trend-followers. Goldman Sachs has identified a significant shift in the behavior of Commodity Trading Advisers (CTAs). These funds, which trade based on price momentum rather than company fundamentals, have already triggered short-term sell signals. Trading desk data suggests that even if the market remains flat this week, these strategies are projected to unload approximately $15.4 billion in US equities. In a rising market, selling could still reach $8.7 billion, while a renewed decline could spark a massive $33 billion outflow within days. A critical technical floor has been established at 6,707 for the S&P 500. A breach below this level is expected to unlock up to $80 billion in additional systematic selling over the next month. This algorithmic pressure comes at a time when investor stress is elevated. The market "Panic Index" recently reached 9.22, signaling a state of "max fear" during last week’s sessions, though a "tsunami" rally on February 6 helped the Dow Jones Industrial Average surge nearly 1,000 points to a new all-time high of 49,871. The broader economic backdrop for 2026 remains a study in contrasts. Goldman Sachs analysts project a "sturdy" global GDP growth of 2.8%, with the US expected to outperform at 2.6%. Earnings resilience is a primary driver, with the S&P 500 forecast to reach 7,600 by year-end, representing a 12% total return. However, professional traders are closely monitoring a "soft" labor market, with the unemployment rate holding at 4.4% and job creation showing signs of cooling. Inflation remains a persistent hurdle, with the PCE price index sitting at 2.9%, well above the Federal Reserve's 2.0% target. This has led to a stabilization of interest rate expectations, with a terminal rate of 3.0% to 3.25% now considered a reasonable baseline. While the AI-driven tech trade continues to underpin growth, market leadership is broadening into cyclical sectors such as Energy, Materials, and Industrials, which outperformed in early February. Investors are now caught between robust corporate earnings and the threat of forced unwinds in leveraged positions. While the long-term outlook remains constructive, the immediate path is defined by high-frequency volatility and the potential for multi-billion dollar algorithmic exits.